
- Title
-
Activation of zebrafish Src family kinases by the prion protein is an amyloid-β-sensitive signal that prevents the endocytosis and degradation of E-cadherin/β-catenin complexes in vivo
- Authors
- Sempou, E., Biasini, E., Pinzón-Olejua, A., Harris, D.A., Málaga-Trillo, E.
- Source
- Full text @ Mol. Neurodegener.

PrP-1 prevents the endocytosis and degradation of AJ components. a. E-cadherin (green) and β-catenin (magenta) localization in 6 hpf deep cells upon treatment with 10 µM Dynasore (DYNA); MO = lissamine-tagged PrP-1 morpholino (red); scale bar = 10 µm. b and d. Total levels of E-cadherin and β-catenin at 6 hpf upon treatment with Dynasore, MG-132 and Chloroquine (Chlq). c. Phenotypic analysis upon treatment with inhibitors. Top: progression of epiboly by 7.5 hpf is assessed by the downward extension of the embryonic margin (arrowheads) relative to the control (dashed horizontal line); brackets show the thickness of the blastoderm. Bottom: phenotypic quantification. Mean values are shown. e. AJ protein levels in 6 hpf embryos injected with increasing PrP-1 morpholino doses. WB = Western blot; IF = immunofluorescence. Red and black arrowheads in 1B, D and E indicate mature E-cadherin (120 kDa) and its more abundant precursor form (140 kDa), respectively. Densitometric analysis of Western blot bands is expressed in arbitrary units (AU) in B, D and E; average values of three independent experiments ± SEM are shown; statistical significance was assessed using unpaired, two-tailed t-tests; ns = not significant (p > 0.05), * = p ≤ 0.05, ** = p ≤ 0.01. In (e), E-cadherin and β-catenin levels were significantly reduced (p ≤ 0.05) at all three morpholino concentrations; p120ctn levels were not significantly changed at any morpholino dose (p > 0.05). See also Additional file 1: Figure S1. |
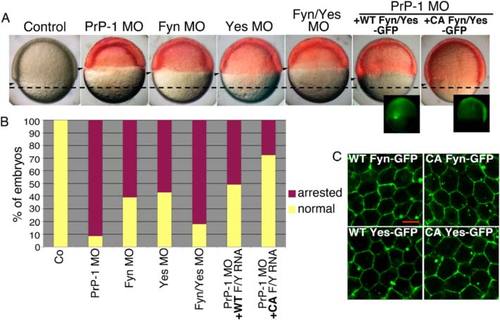
Fyn and Yes act downstream of PrP-1 during epiboly. a. 7.5 hpf embryos injected with different morpholinos or co-injected with PrP-1 morpholino and WT or CA Fyn/Yes EGFP mRNAs. Transmission and fluorescence images are shown merged (morpholinos in red). Expression of WT or CA Fyn/Yes-EGFP (green) is displayed separately on the lower right. Arrowheads and dashed horizontal line as in Fig. 1c. b. Corresponding quantification of embryonic phenotypes at 7.5 hpf. Mean values are shown. c. Expression pattern of WT or CA Fyn- and Yes-EGFP in deep cells of 7.5 hpf PrP-1 morphants. Scale bar = 10 µM PHENOTYPE:
|
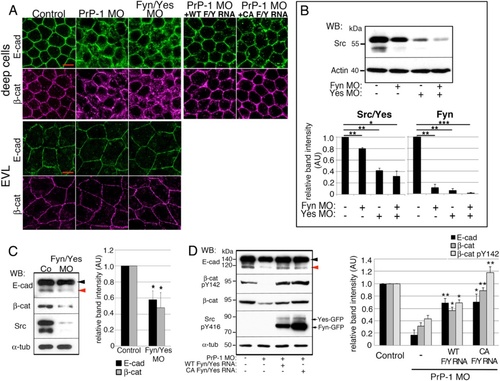
PrP-1 regulates AJs via Fyn and Yes. a. Localization of AJ components (immunofluorescence) in deep (top) and EVL cells (bottom) of 6 hpf PrP-1, Fyn/Yes morphants or PrP-1 morphants co-injected with Fyn/Yes mRNAs. Scale bars = 10 µM. See also Additional file 1: Figure S2. b. Reduction in Src/Yes (65 kDa) and Fyn (50 kDa) total levels in 6 hpf Fyn and Yes single or double knockdowns. c, d. Levels of AJ components in 6 hpf embryo lysates. Activated WT or CA Fyn- and Yes-EGFP were detected with an anti-phospho-Y416 Src antibody. E-cadherin arrowheads as in Fig. 1. WB = Western blot. Densitometric analysis of Western blot bands is expressed in arbitrary units (AU) in b, c and d; average values of three independent experiments ± SEM are shown; statistical significance was assessed using unpaired, two-tailed t-tests; ns = not significant (p > 0.05), * = p ≤ 0.05, ** = p ≤ 0.01, *** = p ≤ 0.001 |
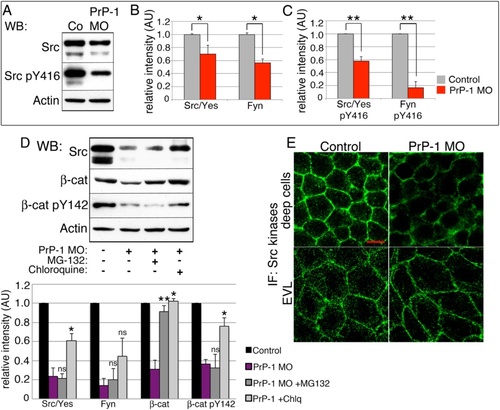
PrP-1 modulates SFK levels and activation. a-c. Levels of total and activated (phosphor-Y416) SFKs in 6 hpf embryos (a), and densitometric analysis of Western blot bands (b and c). Phospho-SFK values were normalized to those of total SFKs. Average values ± SEM of four independent experiments are shown. d. SFK levels in 6 hpf embryos upon PrP-1 knockdown and additional treatment with degradation inhibitors. e. SFK localization in deep (top) and EVL cells (bottom) of 6 hpf embryos. WB = Western blot; IF = immunofluorescence. Scale bar = 10 µM. Densitometric analysis of Western blot bands (b, c and d) is expressed in arbitrary units (AU); average values of four independent experiments ± SEM are shown; statistical significance was assessed using unpaired, two-tailed t-tests; ns = not significant (p > 0.05), * = p ≤ 0.05, ** = p ≤ 0.01. See also Additional file 1: Figure S3. |
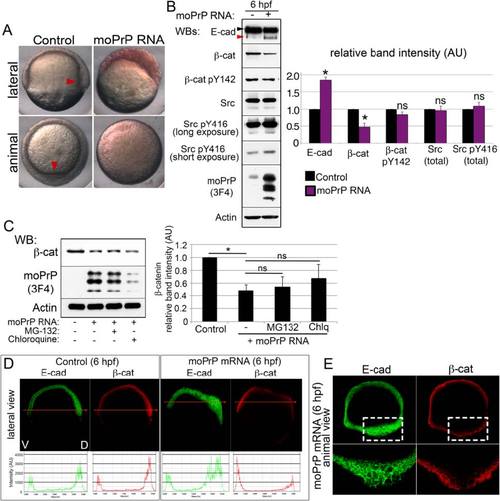
Morphological and molecular phenotypes upon PrP overexpression. a. Shield formation (red arrowhead) in 6 hpf embryos. See also Additional file 2: Video S1. b. Levels of E-cadherin, β-catenin and SFKs in 6 hpf embryos expressing mouse PrP. E-cadherin arrowheads as in Fig. 1. c. Effect of protein degradation inhibitors on the β-catenin levels of PrP-OE embryos. d. Dorsoventral distribution of AJ molecules upon PrP overexpression. Lateral views (midsections) of whole 6 hpf embryos, along with fluorescence profiles through the dorsoventral axis (indicated by red arrows; V = ventral, D = dorsal). See also Additional file 1: Figures S4 and S6. e. Close-up from (d) showing aberrant morphology of dorsal deep cells expressing mouse PrP. WB = Western blot; IF = immunofluorescence. Densitometric analysis of Western blot bands (b and c) is expressed in arbitrary units (AU); average values of four experiments ± SEM are shown; statistical significance was assessed using unpaired, two-tailed t-tests; ns = not significant (p > 0.05), * = p ≤ 0.05 |
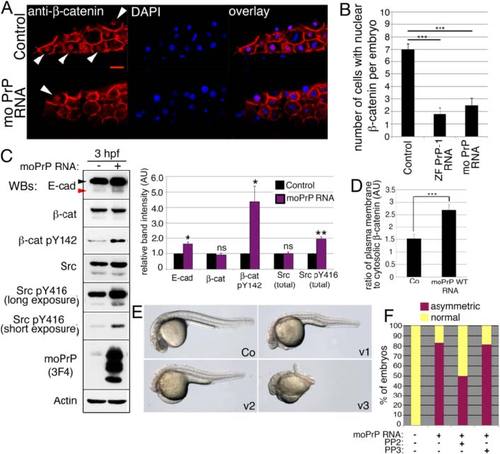
PrP overexpression up-regulates E-cadherin, inhibits nuclear β-catenin and produces ventralized embryos. a. Localization of β-catenin in the nuclei of dorsal marginal blastomeres at 3 hpf (immunofluorescence). Arrowheads indicate β-catenin-positive nuclei. Scale bar = 20 µm. b. Quantification of cells with nuclear β-catenin in 3 hpf embryos expressing zebrafish and mouse WT PrP constructs. Average numbers of cells with nuclear β-catenin per embryo ± SEM are shown (n = 10, three independent experiments); statistical significance was assessed using unpaired, two-tailed t-tests; *** = p ≤ 0.001. c. Levels of E-cadherin, β-catenin and SFKs in 3 hpf embryos expressing mouse PrP (Western blot and densitometric analysis). E-cadherin arrowheads as in Fig. 1. Densitometric analysis of Western blot bands expressed in arbitrary units (AU); average values of three independent experiments ± SEM are shown; statistical significance was assessed using unpaired, two-tailed t-tests; ns = not significant (p > 0.05), * = p ≤ 0.05, ** = p ≤ 0.01. d. Ratios of plasma membrane to cytosolic β-catenin immunofluorescence in dorsal blastomeres of 3 hpf embryos. Mean ratios ± SEM are from 10 cells/embryo (n = 7, three independent experiments); statistical significance assessed by unpaired, two-tailed t-test, *** = p < 0.001. e. Ventralized hypomorphic phenotypes (v1-3) of 1 dpf embryos injected with 20 ng/µl mouse PrP mRNA. f. Quantification of 6 hpf embryos with abnormal dorsoventral specification upon injection of mouse PrP alone, together with PP2, or with its inactive analog PP3 EXPRESSION / LABELING:
|
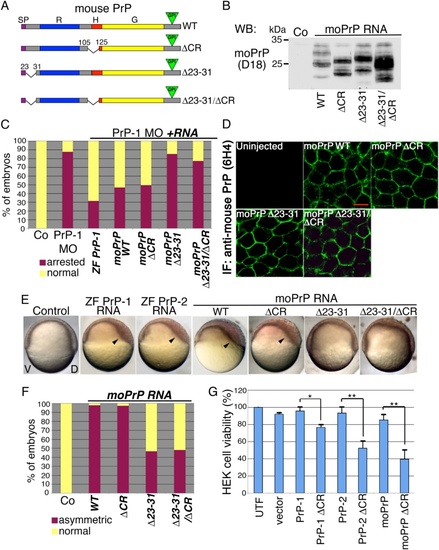
Effect of Δ23-31 and ΔCR deletions on PrP activity. a. Mouse PrP deletion mutants. Protein domains are marked with different colors: SP = signal peptide, R = repetitive domain, H = hydrophobic stretch, G = globular domain; green triangles = GPI-anchor. b. Detection of mouse WT or mutant PrPs using the D18 anti-PrP antibody on 6 hpf embryo protein lysates. c. Phenotypic quantification of 7 hpf embryos co-injected with PrP-1 morpholinos and PrP mRNAs. d. Localization of mouse PrP constructs in the deep cells of 6 hpf embryos (6H4 anti-PrP antibody staining). Scale bar = 10 µm. e. Embryonic phenotypes upon expression of zebrafish (ZF) or mouse (mo) PrP mRNAs (7 hpf, lateral views); arrowheads show abnormal dorsal thickening; V = ventral, D = dorsal. f. Quantification of 7 hpf embryos with dorsoventral phenotypes upon expression of mouse PrPs. Mean values are shown in (c) and (f). g. MTT viability assay of HEK cells expressing mouse or zebrafish PrPΔCRs after Zeocin treatment. WB = Western blot; IF = immunofluorescence. Data are shown as the average percentage of A570 values in untreated cells ± SEM; statistical significance was assessed using unpaired, two-tailed t-tests, * = p ≤ 0.05, ** = p ≤ 0.01 |
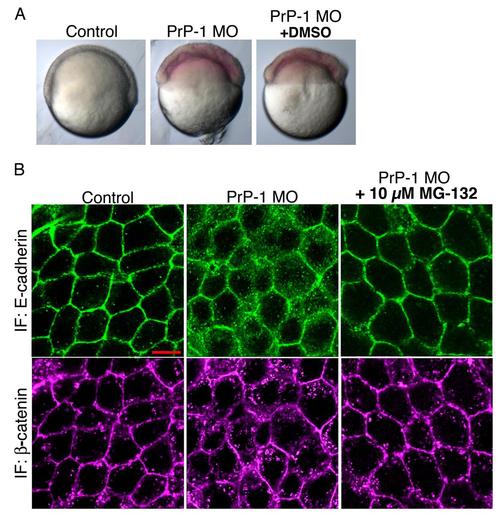
Recovery of epiboly in PrP-1 morphants by treatment with degradation and endocytosis inhibitors. A. Treatment of PrP-1 morphants with DMSO alone does not restore epiboly. B. Treatment with protein degradation inhibitors restores AJ components at the plasma membrane of PrP-1 morphants (only MG-132 shown). Immunofluorescence (IF) analysis of E-cadherin and β-catenin in the deep cell layer of 6 hpf embryos. Scale bar = 10 µM. |
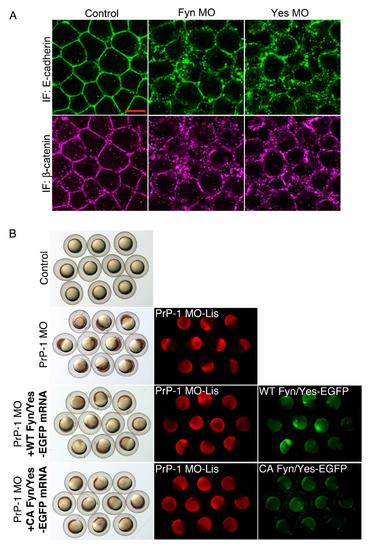
Fyn and Yes act downstream of PrP-1 during epiboly. A. Immunofluorescence (IF) of E-cadherin and β-catenin in 6 hpf Fyn and Yes single knockdown embryos. Scale bar = 10 µM. B. Photos of live embryos at 6 hpf displaying normal or arrested epiboly. Recovery of epiboly is visible in PrP-1 morphants expressing EGFP-tagged WT or CA Fyn and Yes. Lissamine (Lis)-tagged PrP-1 morpholinos were used. |
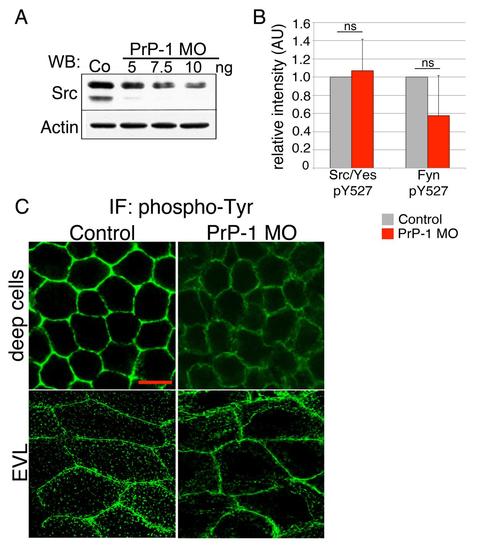
Changes in levels of total or phosphorylated SFKs, and phospho-tyrosine upon PrP-1 knockdown. A. SFK levels in 6 hpf embryos (WB) after injection with increasing PrP-1 morpholino doses. B. Changes in relative p-Tyr527 levels in PrP-1 morphants, as measured by densitometric analysis of WB bands. WB for total or p-Tyr527 SFKs was performed with 6 hpf embryo extracts. Values for phospho Y527 SFKs were normalized to those of total SFKs. Average values ± SEM of three independent experiments are depicted. C. Immunofluorescence of total phosphorylated tyrosine in deep and EVL cells in 6 hpf embryos. Scale bar = 10 µM. |
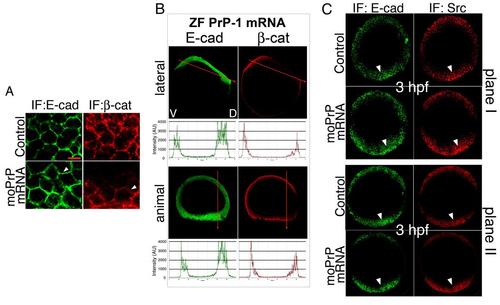
Effects of embryonic PrP OE on the localization of SFKs and AJ components. A. Immunofluorescence in dorsal deep cells of 6 hpf embryos (animal views); arrowheads point at plasma membrane localization; scale bar = 10 µM. B. Gastrula midsections of 6 hpf ZF PrP-1 overexpressing embryos, immunostained as indicated and shown from lateral or animal perspectives. Graphs present fluorescence profiles along the ventral-dorsal axis (indicated by red arrows; V = ventral, D = dorsal). C. Blastula midsections of 3 hpf embryos (two different planes from animal view), immunostained as indicated; arrowheads point at areas of increased immunofluorescence. |
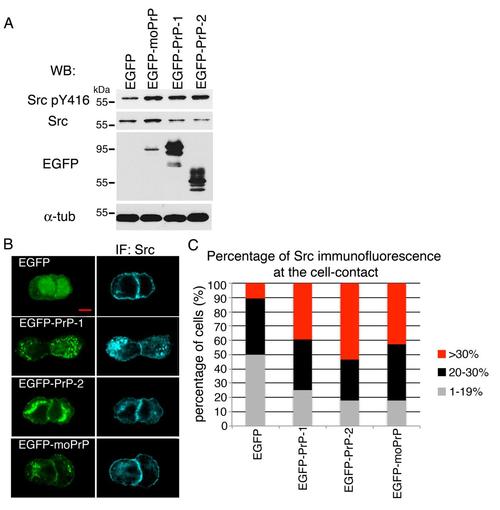
Changes in Src activation and localization upon expression of mouse and zebrafish PrPs in MCF-7 cells. A. WB analysis with lysates of MCF-7 cells expressing EGFP-tagged PrPs. B. Subcellular distribution of EGFP-PrPs and Src immunofluorescence in MCF-7 cells. Scale bar = 10 µM. C. Quantification of Src immunofluorescence at cell-cell contact sites. Graph depicts percentages of cells (average values ± SEM) with different percentage of Src at cell-cell contact sites. Values were normalized to whole cell Src immunofluorescence. |