
- Title
-
The N17 domain mitigates nuclear toxicity in a novel zebrafish Huntington's disease model
- Authors
- Veldman, M.B., Rios-Galdamez, Y., Lu, X.H., Gu, X., Qin, W., Li, S., Yang, X.W., Lin, S.
- Source
- Full text @ Mol. Neurodegener.
Design and demonstration of Cre-loxP inducible HTT-exon 1-GFP expression in transgenic zebrafish. a Schematic of the transgene design using the bactin2 promoter to drive expression of floxed mCherry followed by the HTT-exon 1 cassette being tested. Following Cre expression by mRNA injection or HS:cre transgene induction, mCherry is recombined out and the desired HTT-exon 1 cassette fused to GFP is expressed ubiquitously. b Photo micrographs depicting 5 day old, HTT-exon1(25Q) embryos displaying mCherry expression when Cre is absent (upper panel) or mCherry negative, HTT-exon1-GFP positive expression following cre mRNA injection (bottom two panels). c Close-up view of the trunk of HTT(25Q)-exon1-GFP and mHTT(97Q)-exon1-GFP embryos demonstrating ubiquitous, diffuse expression of HTT-exon1-GFP (left panel) and ubiquitous, aggregated expression of mHTT-exon1-GFP (right panel). d A representative western blot and densitometric measurments for each transgenic line (n = 3). Anti-GFP antibody (top panel) and anti-tubulin loading controls (bottom panel) on protein isolated from pools of 5 day old embryos for each HTT transgenic line crossed to HS:cre. 97Q and 25Q mark the location of mHTT-GFP and HTT-GFP protein bands respectively. Protein expression was highest in HTT-exon1 L1 and HTT-ΔN17-exon1 L1 lines. mHTT-exon1 line 1(L1) and line 2(L2) both express at similar levels as do mHTT-ΔN17-exon1 line 1(L1) and line 2(L2). Densitometric measurements (lower bar graph) demonstrate significantly lower levels of protein in mHTT-exon1 L1 and L2 compared to all other lines while mHTT-ΔN17-exon1 L2 is significantly lower than HTT-exon1 L1 and HTT-ΔN17-exon1 L1. Comparisons were done by one-way ANOVA with Bonferroni posthoc test, **p < 0.01, error bars are SEM. e Quantification of transgene expression by quantitative RT-PCR. Six pools of ten embryos from separate clutches of each HTT transgenic line crossed to HS:cre were analyzed. Comparisons of expression level were done by one-way ANOVA with Bonferonni posthoc test, *p < 0.05, error bars are SEM |
mHTT-N17-exon1 transgenic fish develop a progressive motor behavior phenotype. a Panels taken from Additional file 1: Movie S1 showing normal swimming behavior in a HTT-ΔN17-exon1 transgenic fish. b Panels taken from Additional file 3: Movie S3 showing abnormal swimming behavior, corkscrew swimming, in a mHTT-ΔN17-exon1 transgenic fish. c Disease free survival curve for each HTT-exon1 transgenic line corresponding to disease onset. Note that mHTT-ΔN17-exon1 L1 (n = 10) and L2 (n = 24) both develop symptoms earlier than mHTT-exon1 L1 (n = 16) and that mHTT-exon1 L2 (n = 16), HTT-exon1 (n = 21), and HTT-ΔN17-exon1 (n = 26) do not exhibit symptoms in the observed time frame. Kaplan Meier analysis with Log Rank test, p < 0.001 for mHTT-ΔN17-exon1 L1, mHTT-ΔN17-exon1 L2, and mHTT-exon1 L1. d Behavioral characterization within different transgenic lines. Behavior was grouped into four categories: Healthy, Stage 1, Stage 2, or Stage 3 as described. Observations were made weekly. e Disease progression of mHTT-exon1 L1 fish. Note the discontinuous x-axis to account for the extended time frame of behavioral changes (n = 18). f Disease progression of mHTT-ΔN17-exon1 L1. mHTT-ΔN17-exon1 L1 fish developed a robust, progressive motor behavioral deterioration beginning at 5-8 weeks of age and progressing to immobility and death by 12 weeks (n = 10) PHENOTYPE:
|

mHTT-ΔN17-exon1 accumulates mainly in the nucleus of neurons while mHTT-exon1 aggregates are mostly outside the neuronal cell body. Brain sections from 26 week old HTT-exon1 and mHTT-exon1 fish or 12 week old HTT-ΔN17-exon1 and mHTT-ΔN17-exon1, Stage 3 fish were immunostained to observe the transgenic HTT-exon1 localization. All images are from the hindbrain region and similar staining was present throughout all brain regions in each fish. a-d S830 anti-human HTT Exon 1 antibody was used to detect transgene expression in each transgenic line. HTT-exon1 (a) and HTT-ΔN17-exon1 (c) tissue exhibits uniform, ubiquitous expression. mHTT-exon1 (b) tissue displays many small but distinct aggregates while mHTT-ΔN17-exon1 (d) tissue has many large aggregates. Scale bar equals 25 µm. e-l Immunofluorescent staining of mHTT-exon1 (e-h) and mHTT-ΔN17-exon1 (i-l) transgenic fish for neurons (HuC), transgenic HTT-exon1-GFP fusion protein, and nuclei (DAPI). mHTT-exon1 tissue exhibits many small GFP+ aggregates that are not generally associated with HuC positive neuronal cell bodies suggesting they are either in the axons or dendrites or are non-neuronal (e-h). Occasional, weak nuclear accumulation is present in a few neurons (white arrowheads). mHTT-ΔN17-exon1 tissue has many neuronal, HuC positive, nuclei co-localized with HTT-exon1-GFP (i-l). Scale bar equals 10 µm. m and n 3D confocal projections of mHTT-exon1 (m) and mHTT-ΔN17-exon1 (n) tissue demonstrating weak nuclear HTT-exon1-GFP staining in mHTT-exon1 and strong nuclear staining in mHTT-ΔN17-exon1. Scale bar equals 10 µm. o Quantification of protein accumulation location. Nuclear HTT-exon1 aggregates were rare in HuC negative cells of both lines and mHTT-exon1 transgenic HuC positive neurons. mHTT-ΔN17-exon1 transgenic fish exhibited robust nuclear accumulation of HTT-exon1-GFP in ~40 % of HuC positive cells. ANOVA with Bonferroni posthoc test, (**) p < 0.01 EXPRESSION / LABELING:
|

Neuron specific activation of mHTT-ΔN17-exon1 causes motor behavioral phenotype. a elavl3:cre (n = 23), b gfap:cre (n = 24), c mylpfa:cre (n = 34), and d etv2:cre (n = 21) transgenic lines were incrossed to mHTT-ΔN17-exon1 to activate the transgene specifically in neurons, glia, muscle, and vascular cell lineages respectively. GFP fluorescence in living embryos demonstrates the spatially restricted expression of each line at 5 days post fertilization. e A disease free survival curve demonstrating that only elavl3:cre/mHTT-ΔN17-exon1 fish develop a behavioral phenotype similar to ubiquitous activation of mHTT-ΔN17-exon1, p < 0.01, Kaplan Meier survival analysis. f Disease progression of elavl3:cre/mHTT-ΔN17-exon1 fish is similar to ubiquitious mHTT-ΔN17-exon1 fish although temporally delayed, note the discontinuous x-axis (n = 23). Behavioral Stages are described in Fig. 2. EXPRESSION / LABELING:
PHENOTYPE:
|
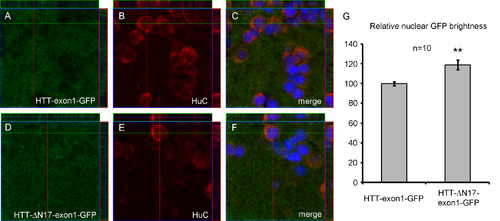
Ubiquitous HTT-exon1-GFP expression in HTT-exon1 and HTT-ΔN17-exon1 lines. 3D projections of confocal images of brain sections from HTT-exon1 L1 (A-C) and HTT-ΔN17-exon1 L1 (D-F) stained for GFP and HuC. Note the faint nuclear GFP staining in HTT while HTT-ΔN17-exon1 has brighter nuclear GFP. (G) Relative nuclear GFP intensity measurements in HuC+ cells comparing HTT-exon1-GFP versus HTT-ΔN17-exon1, n = 10 cells each, **p < 0.01, students t-test. Measurments were made using ImageJ and normalized to average GFP intensity across the entire area. HTT-exon1-GFP was arbitrarily set at 100 %. HTT-ΔN17-exon1 nuclei were approximately 20 % brighter. |