
- Title
-
Tyrosine glycosylation of Rho by Yersinia toxin impairs blastomere cell behaviour in zebrafish embryos
- Authors
- Jank, T., Eckerle, S., Steinemann, M., Trillhaase, C., Schimpl, M., Wiese, S., van Aalten, D.M., Driever, W., Aktories, K.
- Source
- Full text @ Nat. Commun.
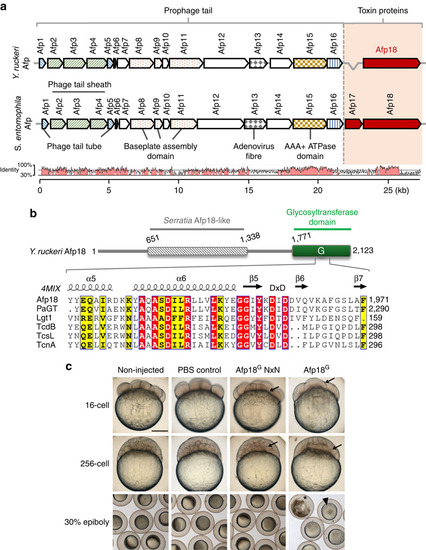
Yersinia ruckeri antifeeding prophage tail (Afp) translocation system and effects of the glycosyltransferase domain of Afp18. (a) Organization of Afp genes from Yersinia ruckeri and Serratia entomophila with their predicted and ascribed protein domains. The toxin units are shown in red. Bottom: pairwise genomic gene analysis of aligned Afp gene clusters using mVISTA (http://genome.lbl.gov/vista). Indicated is the average per cent of nucleotide identity within a window of 20 nucleotides. Nucleotide identity >70% is shaded in red. (b) Architecture of Y. ruckeri Afp18 and similarity to the virulence gene product Afp18 from S. entomophila. Amino-acid sequence alignment of the region surrounding the DxD motif (marked) of different toxin glycosyltransferases. Secondary structure elements are deduced from the crystal structure of PaTox (pdb code 4MIX). Accession numbers are the following: P. asymbiotica PaTox (PaGT, accession number C7BKP9), Legionella pneumophila glucosyltransferase 1 (Lgt1, accession number Q5ZVS2), Clostridium difficile toxin B (TcdB, accession number P18177), C. sordellii lethal toxin (TcsL, accession number Q46342), C. novyi α-toxin (TcnA, accession number Q46149). Alignment was prepared using ClustalW and rendered using ESPript 3.0 (www.espript.ibcp.fr). Identical residues are boxed and shown in red, similar residues are boxed in yellow. (c) Live images of non-injected, PBS buffer control, Afp18G NxN and Afp18G protein (each 3 µM, 1 nl injection) injected zebrafish embryos at indicated developmental stages, 16-cell (1.5 h.p.f.), 256-cell (2.5 h.p.f.) and 30% epiboly (4.7 h.p.f.). Arrows mark blastomere cleavage furrows at 16-cell and 256-cell, embryos are oriented animal to the top. At the 16-cell stage, Afp18G-injected embryo blastomeres show cleavage planes, while blastomeres fail to establish cell boundaries at the 256-cell stage. Control embryos at 30% epiboly develop normally compared with non-injected WT, while Afp18G-injected embryos show disrupted blastoderm (arrowhead) or disintegrate completely (asterisk). Scale bar, 200 µm. |
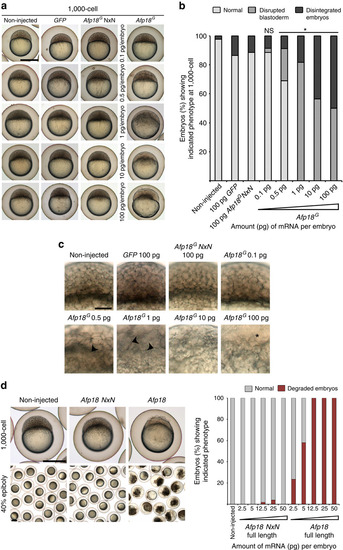
Afp18G disturbs zebrafish early development. (a) Live images of non-injected, GFP, Afp18G NxN mRNA (each 100 pg per embryo), or different amounts (0.1–100 pg per embryo) of Afp18G mRNA-injected embryos at 1,000-cell stage (3 h.p.f.). Embryos oriented animal to the top. Scale bar, 500 µm. (b) Quantification of the blastoderm phenotype of control and Afp18G-injected embryos shown in a at 1,000-cell (non-injected, n=41; GFP mRNA, n=37; Afp18G NxN mRNA, n=52; 0.1 pg Afp18G, n=35; 0.5 pg Afp18G, n=45; 1 pg Afp18G, n=60; 10 pg Afp18G, n=62; 100 pg Afp18G, n=60). Only values for 100 pg per embryo injected GFP and Afp18G NxN mRNA are shown. Developing live embryos were classified into categories ‘normal’ (WT like), ‘disrupted blastoderm’ (cellular structure of blastoderm abnormal) or ‘disintegrated embryos’ (blastoderm and (or) yolk cell lysed). The distribution of phenotypes was analysed for significant differences using Fisher exact probability test, revealing significant differences (*P values <0.0001) between Afp18G NxN control and Afp18G samples. (c) Optical image planes of live blastoderm regions at 1,000-cell (3 h.p.f.) of non-injected, GFP, Afp18G NxN or Afp18G mRNA-injected embryos (pg per embryo) oriented animal to the top. Control embryos show normal development of blastomeres, while the blastoderm progressively loses cellular integrity with increasing amounts of Afp18G mRNA injected. Arrowheads mark the disrupted regions without visible blastomere boundaries, abnormal sized and irregular shaped cells. Asterisks mark detached blastomeres and disintegrated blastoderm. Scale bar, 100 µm. (d) Live images of control, full-length Afp18 and full-length Afp18 NxN mRNA (each 50 pg per embryo) injected zebrafish embryos. Afp18-injected embryos disintegrate at 1,000-cell stage (3 h.p.f., upper row, embryos are oriented animal to the top) and degrade early in gastrulation (lower row 40% epiboly, 5 h.p.f.). Scale bar, 500 µm. For five different concentrations each of Afp18 (non-injected n=80; 2.5 pg n=34; 5 pg n=50; 12.5 pg n=65; 25 pg n=85; 50 pg n=38) and Afp18 NxN (2.5 pg n=43; 5 pg n=58; 12.5 pg n=50; 25 pg n=76; 50 pg n=23) mRNA injections, the bar graph shows percentage of embryos, which at 5 h.p.f. develop like WT controls or degrade. |
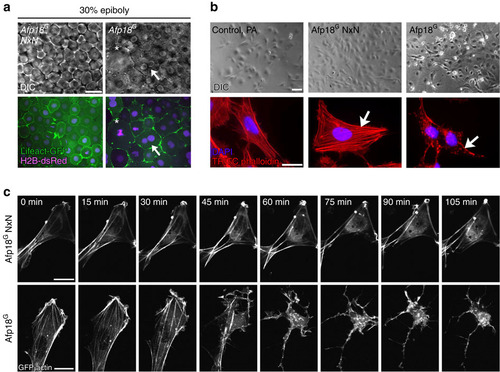
Afp18G affects the actin cytoskeleton. (a) Live images of Afp18G NxN or Afp18G mRNA (each 0.5 pg per embryo) injected embryos at 30% epiboly. Embryos are co-injected with mRNA encoding Lifeact-GFP (green) and H2B-dsRed (magenta; 100 pg per embryo each) labelling the F-actin cytoskeleton and the nuclei. Afp18G NxN embryos developed indistinguishable from WT embryos. Differential interference contrast (DIC) images of blastomeres are shown in the upper row, the corresponding confocal epifluorescence images below. Asterisk marks abnormally large blastomere; the arrow marks a blastomere with two nuclei. Single-plane image, scale bar, 20 µm. (b) Fluorescent micrographs of ZF4 cells treated with 6xHis-tagged Afp18G (right panel) or glycosyltransferase-deficient mutant Afp18G NxN (middle panel) proteins in combination with anthrax protective antigen (PA) as translocation system for His-tagged proteins. Top row shows phase-contrast images. Bottom row shows TRITC-phalloidin staining (red) of the actin cytoskeleton and a DAPI nuclei staining (magenta) of ZF4 cells fixed after 2 h. Arrows indicate regular stress fibres of F-actin in Afp18G NxN cells compared with disrupted F-actin fibres in Afp18G treated cells. Scale bar, 50 µm (top panel), 10 µm (bottom panel). (c) Time-lapse microscopic images of GFP-actin expressing HeLa cells intoxicated with Afp18G NxN (top row) and Afp18G (bottom row) as described in b. Scale bar, 10 µm. DAPI, 4′,6-diamidino-2-phenylindole. |
Afp18G blocks cytokinesis leading to multinucleated cells. (a) Cytoskeleton and cytokinesis analysed by time series of Afp18G NxN (upper row) or Afp18G (lower row) mRNA (0.5 pg per embryo each) injected embryos at dome stage (4.3 h.p.f.). Embryos were co-injected with mRNA encoding Lifeact-GFP (green) and H2B-dsRed (magenta; 100 pg per embryo each) labelling the F-actin cytoskeleton and the nuclei. Asterisk marks dividing blastomeres. Afp18G NxN and Afp18G mRNA-injected blastomeres complete microtubule mediated mitotic phases including chromosome segregation. Arrows indicate the actin ring contraction during cytokinesis, which is strongly affected in Afp18G-dividing blastomeres. Confocal z-stack projection of 10-µm depth; scale bar, 10 µm. (b) Quantification of cytoplasmic versus cortical Lifeact-GFP integrated epifluorescence signal density at indicated developmental stages. Confocal image of Afp18G NxN (left side) and Afp18G (right side) injected embryo showing an example blastomere with manually defined areas of cortical (region depicted in between red and yellow selection) and cytoplasmic (region outlined by yellow selection) F-actin and analysed using Fiji-ImageJ software measure function (sphere, n=12 each; 30% epiboly n=12 each; 50% epiboly n=12 each). Scale bar, 10 µm. Values are average±s.e.m. Statistical significance was evaluated using Mann–Whitney test. |

Afp18G blocks cell blebbing without affecting lamellipodia and filopodia formation. (a) Bleb formation analysed at 30% epiboly (4.7 h.p.f.) by time series of embryos injected with 0.5 pg per embryo of Afp18G NxN mRNA (upper two rows) or Afp18G mRNA (lower two rows). Embryos were co-injected with mRNA encoding Lifeact-GFP (100 pg per embryo) labelling the F-actin cytoskeleton. DIC images are shown in the upper row and corresponding epifluorescence images in the lower row. Black arrowheads indicate spherical membrane protrusions of a blastomere, known as bleb formation, which are initially devoid of actin (white arrowheads). In contrast, blastomeres of Afp18G-injected embryos show significantly less blebbing and blebs appear smaller. Graph shows the quantification of bleb formation of blastomeres in Afp18G mRNA compared with Afp18G NxN control injected embryos (0.5 pg per embryo) during a time series (frames: 10-s intervals for 300s; Afp18G NxN n=75; Afp18G n=75 cells analysed of three different embryos, 25 blastomeres each). Values are average±s.e.m.; statistical significance was analysed using Mann–Whitney test. Scale bar, 10 µm. (b) Protrusive activity analysed in time series of Afp18G NxN (upper two rows) or Afp18G (lower two rows) mRNA (0.5 pg per embryo each) injected embryos at 30% (4.7 h.p.f.). Embryos were co-injected with mRNA encoding Lifeact-GFP (100 pg per embryo) labelling the F-actin cytoskeleton. DIC images are shown in rows 1 and 3 and corresponding fluorescent image in the rows 2 and 4. Both Afp18G NxN and Afp18G mRNA-injected embryos show blastomeres forming sheet-like membrane protrusions resembling lamellipodia, filled with actin bundles and actin branches (arrows). Scale bar, 10 µm. Quantification shows the percentage of analysed blastomeres forming blebs without actin, blastomeres forming sheet-like membrane protrusions with actin or blastomeres without membrane protrusion activity during the captured time series (Afp18G NxN n=41; Afp18G n=37 cells analysed from three different embryos). The statistical significance (P=0.0091) of differences between the proportion of Afp18G NxN and Afp18G blastomeres showing these specific behaviours was computed using the Kruskal–Wallis test. The analysis revealed that the distribution of cell behaviour types indeed differs significantly, caused by changes in blebbing activity but not in lamellipodia formation. DIC, differential interference contrast. |

Functional consequences of tyrosine-34 glyosylation of RhoA. (a) GlcNAcylation of RhoA by Afp18G does not alter nucleotide binding. Fluorimetric analysis of mant-GDP (mGDP) or mant-GppNHp (mGppNHp) binding to WT RhoA or glycosylated RhoA (RhoA-GlcNAc) bound to GDP. Nucleotide exchange was monitored by the increase in fluorescence on mant-nucleotide binding to RhoA. Data are representative of two independent experiments. (b) Nucleotide exchange was measured by mant-GppNHp exchange with WT RhoA, Afp18G-GlcNAcylated RhoA in the presence or absence of LARG. Data are represented as means±s.d. of three technical replicates. (c) Western blot analysis of RhoA, Rac1, Cdc42 pull-down experiments with zebrafish (ZF4) cells treated with Afp18G (plus PA for delivery), Afp18G NxN (plus PA for delivery) and C. difficile toxin B (TcdB). After Rho GTPase activation with CNF1, active RhoA was pulled down with ROCK II-coupled beads and Rac1 and Cdc42 with PAK-coupled beads. Bound GTPases were detected by western blotting using anti-RhoA, anti-Rac1, and anti-Cdc42 antibodies, respectively. Immunoblot of total RhoA is the loading control. (d) Live images at 30% epiboly (4.7 h.p.f.) of control non-injected, GFP mRNA (50 pg per embryo), RHOA mRNA (50 pg per embryo), RHOA Y34F (50 pg per embryo)+ Afp18G mRNA (0.5 pg per embryo), Afp18G mRNA (0.5 pg per embryo) + RHOA mRNA (50 pg per embryo) or Afp18G (0.5 pg per embryo) + RHOA Y34F mRNA (50 pg per embryo) injected embryos. GFP mRNA (50 pg per embryo) was also included in each injection mix, and GFP fluorescence used to examine for homogenous expression: panels show transmitted light images in left columns and corresponding GFP fluorescence images in right columns. GFP, RHOA and RHOA Y34F injected embryos developed indistinguishable from non-injected control embryos. Scale bar, 500 µm. (e) Quantification of percentage embryos that develop normally or were severely affected regarding the organization of the blastoderm in experiment shown in d. Co-injection of RHOA or RHOA Y34F mRNA together with Afp18G mRNA significantly reduces the fraction of disrupted and degraded blastoderm phenotypes, and increases the fraction of embryos developing normally at 30% epiboly. Values are average mean±s.e.m. of four biological replicates. Significance (P values <0.001) of changes in phenotype distribution was valuated using the Kruskal–Wallis test. |