
- Title
-
In Vivo Angiogenesis Screening and Mechanism of Action of Novel Tanshinone Derivatives Produced by One-Pot Combinatorial Modification of Natural Tanshinone Mixture from Salvia Miltiorrhiza
- Authors
- Zhang, Z.R., Li, J.H., Li, S., Liu, A.L., Hoi, P.M., Tian, H.Y., Ye, W.C., Lee, S.M., Jiang, R.W.
- Source
- Full text @ PLoS One
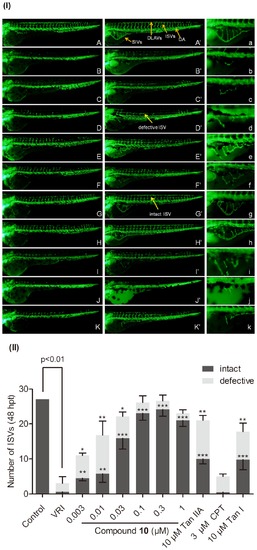
The effects of compound 10 on VRI-induced blood vessels loss in Tg(fli-1a:EGFP)y1 zebrafish compared to Tan IIA, CPT and Tan I. (I) (A-A′) Control group: 24 hpf zebrafish embryos were treated with 0.1% DMSO (v/v) for 24 h and 48 h. 21 hpf embryos were treated with VRI (500 ng/ml) for 3 h. After that, the VRI was washed out and replaced with 0.1% DMSO (v/v) embryo medium (B-B′) or 10 [0.003 μM(C-C′), 0.01 μM(D-D′), 0.03 μM (E-E′), 0.1 µM (F-F′), 0.3 μM (G-G′),1 μM(H-H′)], 10 μM Tan IIA (I-I′), 3 μM CPT (J-J′) and 10 μM Tan I (K-K′)for 24 h and 48 h respectively. (a–k) Enlarged SIVs region (x 2.5) of (A′–K′) respectively. Yellow arrows indicated that the ISVs (intact and defective), SIVs, DLAVs, and DA. (II) Quantitative analysis of compounds on VRI-treated zebrafish. Number of defective and intact ISVs in each embryo was quantified by counting a minimum of 15 embryos per group at 48 hpt. Data are plotted as mean±SEM, (ng3). *p<0.05, **p<0.01 and ***p<0.001 versus the VRI-only treatment group. |

The effects of SU5402 and PD153035 on compound 10-induced angiogenesis in VRI-treated zebrafish. (I) 24 hpf zebrafish embryos were treated with 0.1% DMSO (v/v) (A), 20 μM SU5402 (D) and 5 μM PD153035 (F) for 24 h. 21 hpf embryos were treated with VRI (500 ng/ml) for 3 h. After that, the VRI was washed out and replaced with 0.1% DMSO (v/v) embryo medium (B) or 0.3 μM 10 (C), 0.3 μM 10 and 20 μM SU5402 (E), 0.3 μM 10 and 5 μM PD153035 (G) for another 24 h. Yellow arrows indicated that the ISVs (intact and defective), SIVs, DLAVs, and DA. (II) Quantitative analysis of inhibitory effect of SU5402 and PD153035 on 10-induced angiogenesis in VRI-treated zebrafish. Data are expressed as mean±SEM, (ng3). **p<0.01 and ***p<0.001 versus the 10 treatment group. |

The effects of inhibitors of the downstream targets of FGF and VEGF signaling pathways on compound 10-induced angiogenesis in VRI-treated zebrafish. (I) 24 hpf zebrafish embryos were treated with 0.1% DMSO (v/v)(A),10 μM PP2 (D), 10 µM LY294002 (F),5 μM P38i (H), 50 μM Rafi (J),20 μM MEK1/2 (L),25 μM ERK1/2i (N) for 24 h. 21 hpf embryos were treated with VRI (500 ng/ml) for 3 h. After that, the VRI was washed out and replaced with 0.1% DMSO (v/v) embryo medium (B) or 0.3 μM 10 (C), 0.3 μM 10 and 10 μM PP2 (E), 0.3 μM 10 and 10 μM LY294002 (G), 0.3 μM 10 and 5 μM P38i (I), 0.3 μM 10 and 50 μM Rafi (K), 0.3 μM 10 and 20 μM MEK1/2i (M), 0.3 μM 10 and 25 μM ERK1/2i (O) for another 24 h. Yellow arrows indicated that the ISVs (intact and defective), SIVs, DLAVs, and DA. (II) Quantitative analysis of inhibitory effect of inhibitors of the downstream targets of FGF and VEGF signaling pathways. Data are expressed as mean±SEM, (ng3). *p<0.05, **p<0.01 and ***p<0.001 versus the 10 treatment group. |