
- Title
-
From seeing to believing: labelling strategies for in vivo cell-tracking experiments
- Authors
- Progatzky, F., Dallman, M.J., and Lo Celso, C.
- Source
- Full text @ Interface Focus
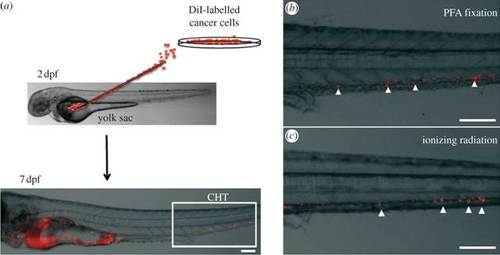
Live/dead control experimental design. (a) A549 cells labelled with CM-DiI were injected into the yolk sac of wild-type zebrafish embryos at 48 h post-fertilization and in vivo imaging was performed 5 days later. (b,c) Higher magnification images of the CHT area, where CM-DiI signal was detected despite cells being treated with toxic doses of PFA or ionizing radiation prior to injection. This level and type of CM-DiI signal therefore cannot be used to quantify micrometastasis formation. Scale bars, 100 µm. |

A549 cells labelled with DiO (green) were injected into the yolk sac of an fms:mCherry zebrafish at 48 h post-fertilization. Five days later partial overlap between DiO (A549 cells) and mCherry (macrophages) signals is detected (yellow), indicating that dye transfer has occurred, probably as a consequence of phagocytosis of dead A549 cells. Scale bar, 100 µm. |