
- Title
-
A zebrafish model of congenital disorders of glycosylation with phosphomannose isomerase deficiency reveals an early opportunity for corrective mannose supplementation
- Authors
- Chu, J., Mir, A., Gao, N., Rosa, S., Monson, C., Sharma, V., Steet, R., Freeze, H.H., Lehrman, M.A., and Sadler, K.C.
- Source
- Full text @ Dis. Model. Mech.
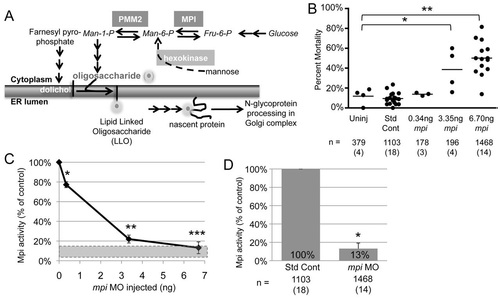
Titration of mpi morpholino results in dose-dependent mortality and Mpi enzyme knockdown. (A) Abridged schematic of N-glycosylation focused on the MPI and PMM2 enzymatic steps. (B) Zebrafish embryos were injected with mpi ATG blocking morpholino (MO) and collected at 4 days post-fertilization (dpf). Cumulative mortality on 4 dpf for the increasing amounts of mpi MO injected are shown. * and **, P<0.0001 by Fisher’s exact test. Numbers in parentheses under n values indicate the number of experiments. (C) Mpi activity was measured in 4 dpf lysates (normalized to total protein) using the standard coupled assay for this enzyme. Mpi activity expressed as the percent of control activity is shown. Gray bar indicates the range of Mpi activity demonstrated in MPI-CDG individuals (3-18%). *P=0.04; **P=7.52E-06; ***P=1.38E-18 by unpaired t-test. (D) Mpi enzyme activity is 13% (as compared with standard control MO) when 6.7 ng of mpi MO is injected. *P<0.0001 by Fisher’s exact test. PHENOTYPE:
|
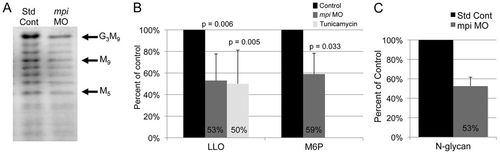
Mpi knockdown decreases full-length LLO and mannose-6-phosphate levels in zebrafish. (A) Full-length LLO (G3M9) levels are decreased by Mpi knockdown, as seen on FACE analysis. (B) G3M9 LLO (normalized to number of fish) and mannose-6-phosphate (M6P) levels (normalized to 100 microgram protein) in lysates from 4 dpf zebrafish larvae. Values from larvae injected with the standard control morpholino were set as 100%. Average from three experiments. (C) N-glycans are decreased to 53% in mpi morphants on FACE analysis as compared with standard controls (n=2 experiments). PHENOTYPE:
|

mpi morphants develop multi-systemic abnormalities. (A) Injection of 6.7 ng of mpi MO results in morphants that are characterized by a small head, microphthalmia, pericardial edema, jaw defects and reduced liver size as visualized in live fish expressing dsRed in hepatocytes [Tg(fabp10:dsRed)] from 30 to 100 hpf. Scale bar: 50 μm. (B) Embryo clutches injected with mpi MO have an average of 15% phenotypically normal embryos as compared with 93% of control embryos. Range from 0–35% normal. P<0.0001 by Fisher′s exact test. Numbers in parentheses under n values indicate the number of experiments. (C) Injection of 6.7 ng of mpi MO results in abnormal liver development. Liver size correlated with severity of phenotype. (D) ‘Phenotype score’ equation. (E) Linear regression analysis shows that phenotype score is inversely correlated with residual Mpi enzyme activity. |
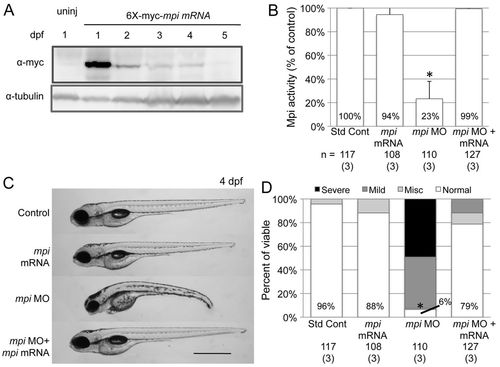
mpi morphants are rescued with mpi mRNA. Full-length zebrafish mpi mRNA was cloned using degenerate sequencing primers surrounding the ATG site so that no significant overlap with MO sequence would occur. The embryos were injected with either standard control MO, mpi MO, 6×-myc-mpi mRNA or mpi MO + 6×-myc-mpi mRNA. (A) Western blot showing Mpi expression in embryos from 1 to 5 dpf after mpi mRNA injection at t=0. (B) Restoration of Mpi enzyme activity in embryos injected with either mpi mRNA only or co-injected with mpi MO + mRNA (P=0.47 and 0.80 by paired t-test, respectively, as compared with standard control MO). *P=0.047 by paired t-test. Results from three experiments. (C) mpi morphants show phenotypic rescue when co-injected with 6×-myc-mpi mRNA. Scale bar: 50 μm. (D) At 4 dpf, 78% of morphants injected with 6×-myc-mpi mRNA were rescued to normal as compared with 6% normal in mpi MO embryos; * P<0.0001 by Fisher′s exact test. Numbers in parentheses under n values indicate the number of experiments. |
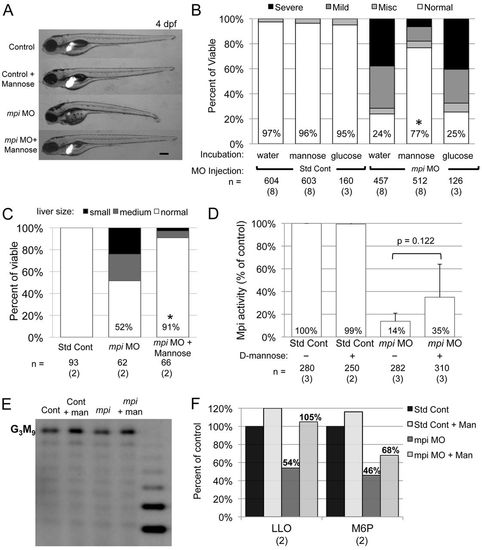
Mannose supplementation rescues mpi morphants. (A) Phenotype rescue of mpi morphants treated with 50 mM mannose at 4 dpf. Liver visualized using Tg(fabp10:dsRed). Scale bar: 100 μm. (B) 77% of mpi morphants treated with 50 mM mannose from fertilization through 4 dpf appear completely normal, whereas no rescue is seen with glucose. *P<0.0001 by Fisher′s exact test as compared with mpi MO + water or mpi MO + glucose supplementation. (C) Liver size is improved in mpi morphants treated with mannose supplementation. *P<0.0001 by Fisher′s exact test. (D) Mpi activity is not significantly changed with mannose supplementation. (E) FACE analysis with quantification showing restoration of G3M9 LLO levels in mpi morphants treated with mannose as compared with mpi MO alone. Average of two experiments. (F) LLO and M6P levels are increased in mpi morphants treated with mannose to 105% and 68%, respectively. Average of two experiments. Numbers in parentheses under n values indicate the number of experiments. PHENOTYPE:
|
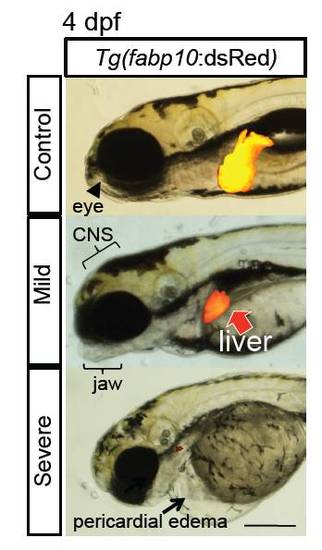
mpi morphants show multisystemic defects, including abnormal liver development as visualized in Tg(fabp10:dsRed) embryos at 4 dpf. Scale bar = 500 microns. |
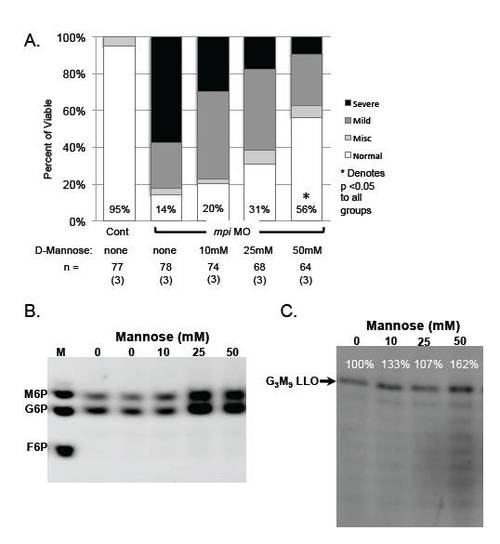
Mannose titration shows increased rescue of mpi MO phenotype, increased M6P levels, and no degradation of LLO levels. A.) Phenotypic scoring of control and mpi MO injected embryos treated with increasing concentrations of D-mannose from 0 to 96 hpf. B.) M6P levels increase in control embryos treated with increasing mannose concentrations from 0 to 50mM. C.) FACE analysis showing no degradation of G3M9 LLO with increasing concentrations of mannose from 0 to 50mM. |