
- Title
-
Identification and Regulation of a Molecular Module for Bleb-Based Cell Motility
- Authors
- Goudarzi, M., Banisch, T.U., Mobin, M.B., Maghelli, N., Tarbashevich, K., Strate, I., van den Berg, J., Blaser, H., Bandemer, S., Paluch, E., Bakkers, J., Toli-Nørrelykke, I.M., and Raz, E.
- Source
- Full text @ Dev. Cell
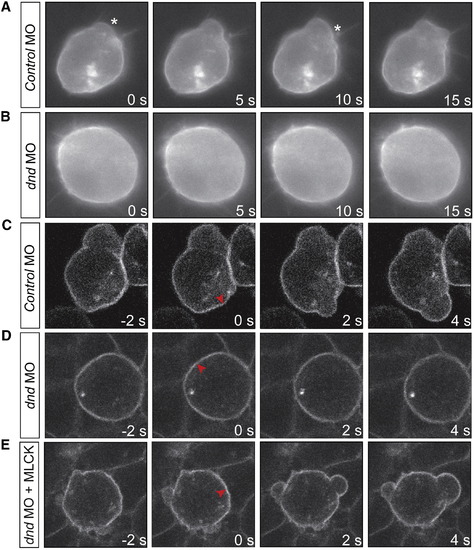
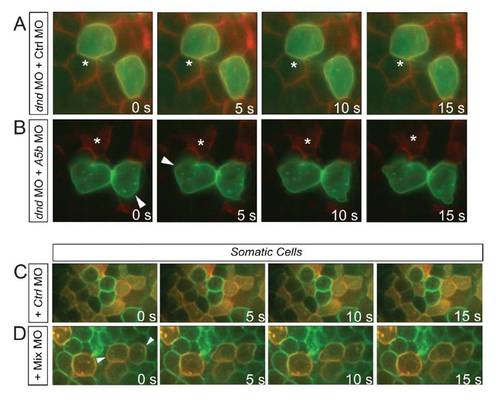
Lack of Bleb Formation in PGCs Knocked Down for Dnd Is Correlated with Reduced Contractility(A) Control germ cells form blebs in the direction of migration. Asterisks mark bleb initiation.(B) Lack of blebs in cells depleted for the Dnd protein.(C) Cortex ablation induces blebs in control cells.(D) Lack of bleb induction by a similar manipulation in cells knocked down for Dnd.(E) MLCK restores bleb formation in response to cortex ablation.Red arrowheads indicate the ablation point. See also Movies S1 and S2. PHENOTYPE:
|
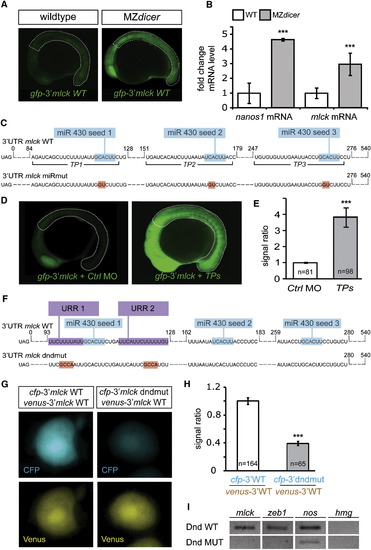
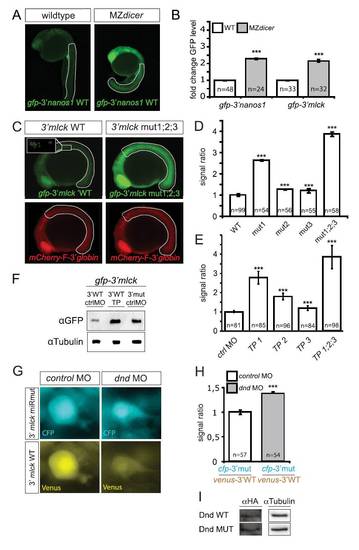
Control of MLCK Expression by microRNAs and Dnd Protein(A) Lack of miRNAs in MZdicer embryos results in higher GFP signal from a reporter containing the 3′ UTR of mlck, measured at 16 hpf within the dotted line marked areas (for quantitation, see Figure S1B).(B) qPCR analysis comparing the endogenous levels of mlck and nanos mRNAs in wild-type and MZdicer embryos.(C) The 3′ UTR of mlck contains seed sequences for miR-430 (blue). Binding sites for target protector (TP) morpholinos that mask the miRNA seeds (TP1-3) are indicated and point mutations disrupting the seeds are labeled in red.(D) Application of TPs increases GFP expression from the reporter RNA as compared to embryos treated with control morpholinos.(E) Quantitative representation of the results of the experiment in (D), depicting the GFP signal level within the dotted line in (D) normalized to that of a coinjected mCherry control.(F) The 3′ UTR of mlck contains two putative URR sites for Dnd binding (violet) adjacent to miR-430 seed sequences (blue). Mutations introduced are marked in red.(G) Mutating the URRs in mlck 3′ UTR results in reduced CFP expression in the PGCs as compared to the control wild-type 3′ UTR. The coinjected RNA (venus-3′mlck WT) served as a control.(H) Quantitative representation of the normalized signal intensity in the experiment presented in (G).(I) Immunoprecipitation of Dnd protein followed by RT-PCR for bound RNAs showing binding of Dnd to mlck and zeb1 compared to that of a Dnd version impaired for RNA binding (Dnd.MUT; Y104C, Slanchev et al., 2009). Amplification of nanos and hmg transcripts served as control.n signifies the number of PGCs examined in (H) or the number of embryos analyzed in (E). Error bars depict the SEM and the p < 0.001, calculated using two-tailed, unpaired t test.>See also Figure S1. |
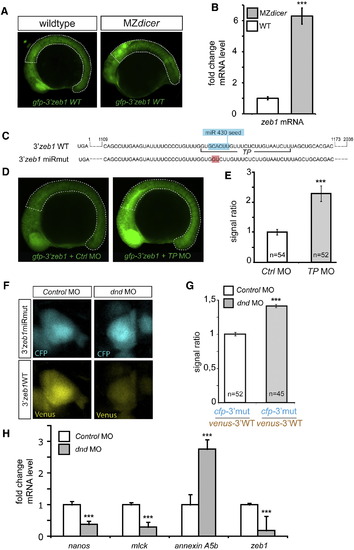
Control of ZEB1 and Annexin A5b Expression by miRNAs and Dnd(A) Lack of miRNAs in MZdicer embryos results in higher GFP signal from a reporter containing the 3′ UTR of zeb1, measured at 16 hpf from the line marked areas (Figure S2A).(B) qPCR analysis comparing the endogenous levels of zeb1 mRNA in MZdicer and wild-type embryos.(C) The 3′ UTR of zeb1 contains a seed sequence of miR-430 (blue). Binding site for the target protector (TP) morpholino masking the miRNA seed (TP) is indicated and the point mutation disrupting the seed is labeled in red.(D) Application of TPs increases GFP expression from the reporter RNA as compared to embryos treated with control morpholinos.(E) Quantitative representation of the results of the experiment in (D) measured within the area marked by the dotted lines in (D), depicting the GFP signal level normalized to that of a coinjected mCherry control.(F) Expression of the Venus protein from RNA containing the wild-type zeb1 3′ UTR is reduced in dnd MO treated PGCs as compared to that from an RNA reporter mutated for miRNA binding (cfp-3′zeb1 miRmut).(G) Quantitative representation of the results in (F).(H) qPCR analysis of endogenous annexin A5b, nanos, mlck, and zeb1 mRNA in PGCs isolated from Dnd knocked-down embryos compared to control morpholino-injected animals.n is the number of embryos analyzed in (E) or the number of PGCs examined in (G). Error bars depict the SEM and p < 0.001, calculated using two-tailed, unpaired t test.See also Figure S2. |
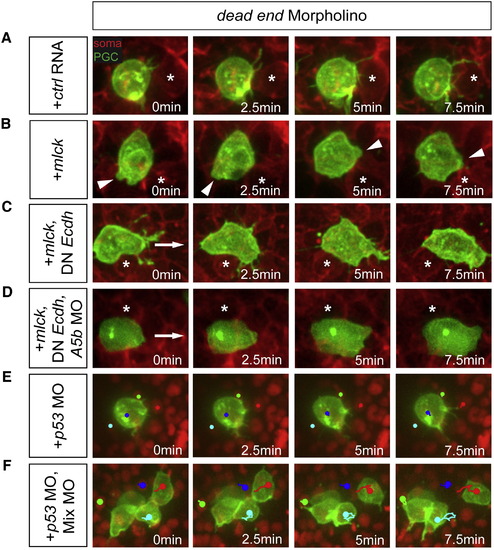
Motility Reprogramming of PGCs and Somatic Cells(A) dnd MO treated PGCs (green) are immotile with respect to somatic cells (red).(B) Bleb formation in immotile dnd MO treated PGCs overexpressing MLCK.(C) Motility of dnd MO-treated PGCs expressing MLCK and a dominant-negative E-cadherin.(D) Enhanced motility of dnd MO-treated PGCs knocked down for Annexin A5b in addition to the manipulation in (C).(E and F) Dnd-depleted PGCs treated with p53 morpholino (E). Tracking a nucleus of such a round PGC (blue track) reveals no movement relative to somatic cells (light blue, green, and red). Such cells treated with a morpholino mixture (F), show active migration (red and light blue tracks for PGCs, green and blue for somatic cells) and cell shape changes.Asterisks mark a stationary reference point in the soma. Arrowheads point at bleb formation positions. Arrows indicate direction of movement.See also Figure S3 and Movies S4 and S5. PHENOTYPE:
|
Related to Figure 2. Control of MLCK expression by microRNAs and the Dnd protein |
Related to Figure 4. Motility reprogramming |
Reprinted from Developmental Cell, 23(1), Goudarzi, M., Banisch, T.U., Mobin, M.B., Maghelli, N., Tarbashevich, K., Strate, I., van den Berg, J., Blaser, H., Bandemer, S., Paluch, E., Bakkers, J., Toli-Nørrelykke, I.M., and Raz, E., Identification and Regulation of a Molecular Module for Bleb-Based Cell Motility, 210-218, Copyright (2012) with permission from Elsevier. Full text @ Dev. Cell