
- Title
-
Evolution of genetic networks underlying the emergence of thymopoiesis in vertebrates
- Authors
- Bajoghli, B., Aghaallaei, N., Hess, I., Rode, I., Netuschil, N., Tay, B.H., Venkatesh, B., Yu, J.K., Kaltenbach, S.L., Holland, N.D., Diekhoff, D., Happe, C., Schorpp, M., and Boehm, T.
- Source
- Full text @ Cell
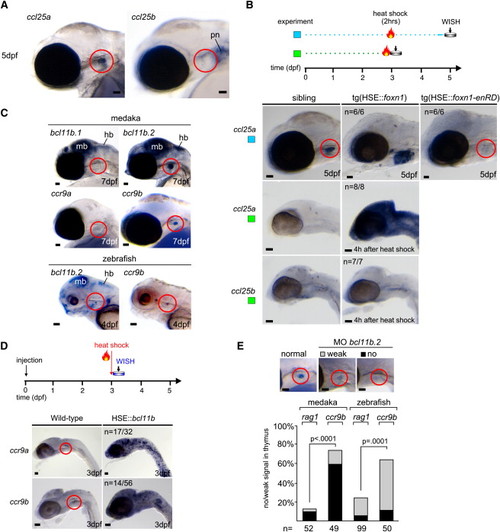
Characterization of foxn1/ccl25 and bcl11b/ccr9 Networks (A and B) The gene encoding the ccl25a chemokine is a down-stream target of foxn1. (A) Whole-mount RNA in situ hybridization indicates that only ccl25a, and not ccl25b, is expressed in the thymus (red circle) of medaka embryos. pn, pronephros. The gene encoding the chemokine ccl19 is not expressed in the thymus (data not shown). (B) Induction of wild-type foxn1 (HSE::foxn1) or dominant-negative foxn1 (HSE::foxn1-enRD) in transgenic lines augments ccl25a expression in the thymus (red circle) or abolishes it, respectively. The number of embryos with the indicated expression patterns is shown. Note that ccl25b expression is unaffected by foxn1 (bottom panel). (C–E) The transcription factor bcl11b participates in the regulation of expression of the ccr9 chemokine receptor. (C) Only one of the bcl11b homologs of medaka and zebrafish is expressed in the thymus as detected by whole-mount RNA in situ hybridization (bcl11a.1 and bcl11a.2 are not expressed in the thymus; data not shown); both homologs of ccr9 are expressed, but ccr9b shows stronger expression in the thymus (see Figure S5). bcl11b genes are coexpressed in the midbrain (mb) and hindbrain (hb). (D) Transient misexpression of Bcl11b results in overexpression of ccr9. Mouse Bcl11b cDNA was cloned into the heat-shock vector shown in Figure 2B. The number of embryos with the indicated expression patterns is shown; position of the thymus is marked by red circle. (E) Knockdown of bcl11b.2 selectively abolishes ccr9 expression in the thymus, while only mildly affecting rag1 expression (morpholino concentration was 800 μM for medaka and 500 μM for zebrafish embryos); in embryos injected with a control morpholino, rag1 expression levels are normal (data not shown; see also Figure 5C). Examples of expression patterns and their classification in medaka embryos are shown at the top. The position of the thymus is highlighted in red. Scale bars represent 50 μm. EXPRESSION / LABELING:
|
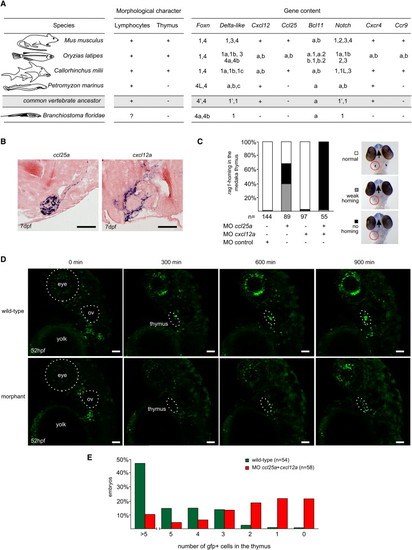
Functional Analysis of Thymus Colonization in Medaka Embryos (A) Gene content of chordate genomes and the presence of lymphocytes and thymus. The presence of the thymus (Pastoret et al., 1998) correlates with the emergence of Foxn1, Ccl25, Bcl11b, and Ccr9 genes. See Figures S1, S3, and S4–S7 for details. The presence of bona fide lymphocytes in amphioxus is unclear (Ruppert, 1997). The information given for the common vertebrate ancestor is hypothetical; paralogs are indicated by apostrophes. (B) Expression of chemokine genes ccl25a and cxcl12a in the thymic rudiment of medaka embryos as detected by RNA in situ hybridization on tissue sections. ccl25a, but not ccl25b (see Figure 4A), is expressed in the epithelial rudiment of the thymus; cxcl12a, but not cxcl12b (data not shown), is expressed in the connective tissue encapsulating it. The chemokine receptor genes ccr7 and cxcr7 are not expressed in the thymus (data not shown). Scale bars represent 50µm. (C) Synergism of ccl25a and cxcl12a in the regulation of thymus homing in medaka embryos; double morphants lack rag1-expressing cells in the thymus but are otherwise normal (as examined by expression of dlx2 and l-plastin; data not shown). Morpholino concentrations were 200 μM each, with the exception of the control morpholino, which was 1 mM. Examples of WISH results for classification of embryos are shown in the right panel. (D) Time-lapse recording of thymus homing in zebrafish wild-type (upper panels) and ccl25a/cxcl12 morphants (at 100 μM each; lower panels). Still photographs taken at various time points (0 min corresponds to 52 hpf; before the onset of homing) highlighting the homing of ikaros expressing lymphoid progenitors to the thymus in zebrafish embryos transgenic for ikaros::gfp. Frames are taken from Movie S1 (wild-type) and Movie S2 (morphants). Note that thymus homing eventually resumes in morphants, owing to the dilution of morpholinos in dividing cells. Scale bars represent 50 μm. (E) Thymus homing in wild-type and ccl25a/cxcl12a morphant (at 100 μM each) |
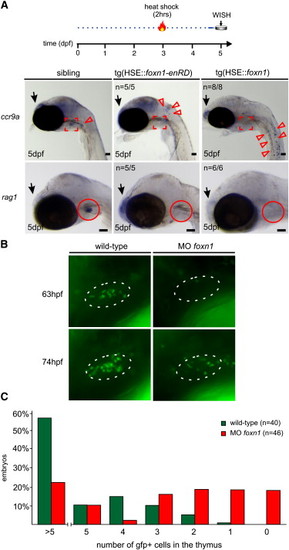
Evolutionarily Conserved Function of foxn1 in Thymopoiesis (A) Interference with foxn1 function by transient overexpression abolishes thymopoiesis in transgenic medaka embryos. Expression of a dominant-negative form of foxn1 leads to accumulation of ccr9a-expressing lymphoid progenitors (red arrowheads) in the vicinity of the thymus (marked in red), whereas overexpression of wild-type foxn1 leads to their dispersal in the entire embyro (top panels). Thymopoiesis fails as indicated by the lack of rag1-expressing cells (bottom panels). The number of embryos with the indicated phenotypes is shown. Scale bars represent 50 μm. (B) Impaired thymopoiesis in zebrafish foxn1 morphants. Photographs were taken at the indicated time points from the thymus region of wild-type (left panels) or morphant (at 200 μM each; right panel) embryos of the ikaros::gfp transgenic line. Note that thymus homing eventually resumes in morphants owing to the dilution of morpholinos in dividing cells. (C) Thymus homing in wild-type and foxn1 morphant zebrafish embryos. The percentages of embryos with the indicated number of cells in the thymus are shown for the 63 hpf time point. PHENOTYPE:
|
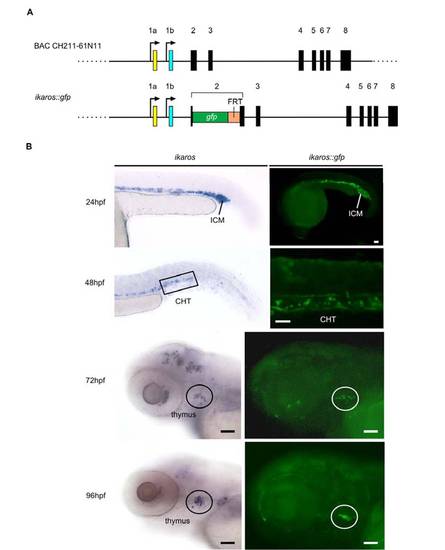
Characterization of the ikaros::gfp zebrafish transgenic line. |
Reprinted from Cell, 138(1), Bajoghli, B., Aghaallaei, N., Hess, I., Rode, I., Netuschil, N., Tay, B.H., Venkatesh, B., Yu, J.K., Kaltenbach, S.L., Holland, N.D., Diekhoff, D., Happe, C., Schorpp, M., and Boehm, T., Evolution of genetic networks underlying the emergence of thymopoiesis in vertebrates, 186-197, Copyright (2009) with permission from Elsevier. Full text @ Cell