
Fig. 5
- ID
- ZDB-IMAGE-101025-35
- Publication
- Bajoghli et al., 2009 - Evolution of genetic networks underlying the emergence of thymopoiesis in vertebrates
- All Figures
- Figures for Bajoghli et al., 2009
|
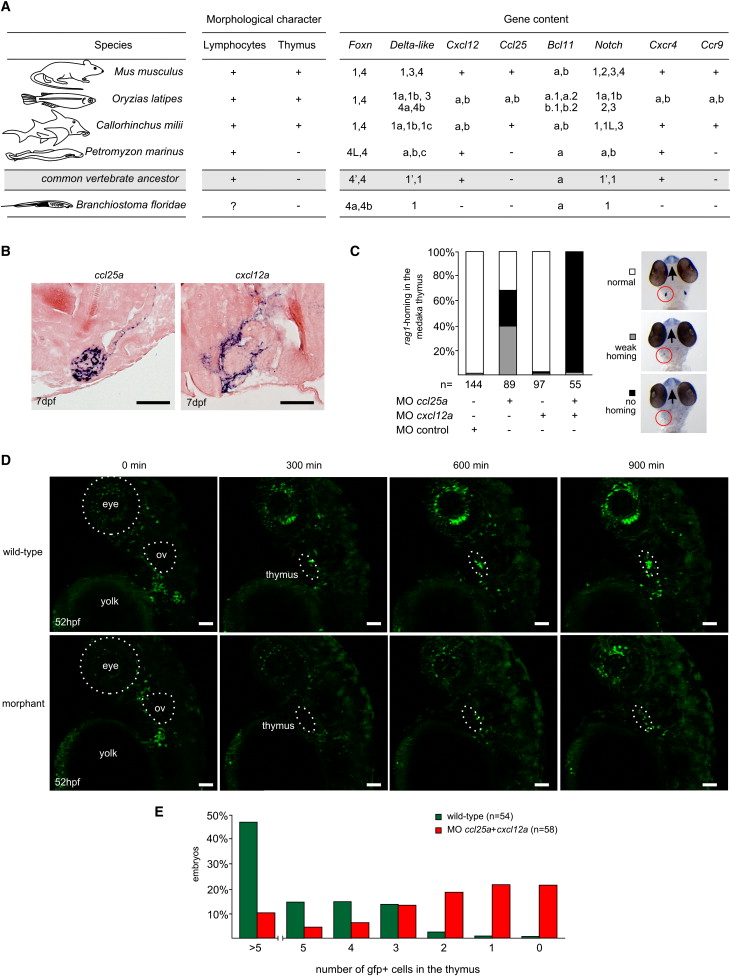
Fig. 5 Functional Analysis of Thymus Colonization in Medaka Embryos
(A) Gene content of chordate genomes and the presence of lymphocytes and thymus. The presence of the thymus (Pastoret et al., 1998) correlates with the emergence of Foxn1, Ccl25, Bcl11b, and Ccr9 genes. See Figures S1, S3, and S4–S7 for details. The presence of bona fide lymphocytes in amphioxus is unclear (Ruppert, 1997). The information given for the common vertebrate ancestor is hypothetical; paralogs are indicated by apostrophes.
(B) Expression of chemokine genes ccl25a and cxcl12a in the thymic rudiment of medaka embryos as detected by RNA in situ hybridization on tissue sections. ccl25a, but not ccl25b (see Figure 4A), is expressed in the epithelial rudiment of the thymus; cxcl12a, but not cxcl12b (data not shown), is expressed in the connective tissue encapsulating it. The chemokine receptor genes ccr7 and cxcr7 are not expressed in the thymus (data not shown). Scale bars represent 50µm.
(C) Synergism of ccl25a and cxcl12a in the regulation of thymus homing in medaka embryos; double morphants lack rag1-expressing cells in the thymus but are otherwise normal (as examined by expression of dlx2 and l-plastin; data not shown). Morpholino concentrations were 200 μM each, with the exception of the control morpholino, which was 1 mM. Examples of WISH results for classification of embryos are shown in the right panel.
(D) Time-lapse recording of thymus homing in zebrafish wild-type (upper panels) and ccl25a/cxcl12 morphants (at 100 μM each; lower panels). Still photographs taken at various time points (0 min corresponds to 52 hpf; before the onset of homing) highlighting the homing of ikaros expressing lymphoid progenitors to the thymus in zebrafish embryos transgenic for ikaros::gfp. Frames are taken from Movie S1 (wild-type) and Movie S2 (morphants). Note that thymus homing eventually resumes in morphants, owing to the dilution of morpholinos in dividing cells. Scale bars represent 50 μm.
(E) Thymus homing in wild-type and ccl25a/cxcl12a morphant (at 100 μM each)
Reprinted from Cell, 138(1), Bajoghli, B., Aghaallaei, N., Hess, I., Rode, I., Netuschil, N., Tay, B.H., Venkatesh, B., Yu, J.K., Kaltenbach, S.L., Holland, N.D., Diekhoff, D., Happe, C., Schorpp, M., and Boehm, T., Evolution of genetic networks underlying the emergence of thymopoiesis in vertebrates, 186-197, Copyright (2009) with permission from Elsevier. Full text @ Cell