
- Title
-
cAMP/PKA Regulates Osteogenesis, Adipogenesis and Ratio of RANKL/OPG mRNA Expression in Mesenchymal Stem Cells by Suppressing Leptin
- Authors
- Yang, D.C., Tsay, H.J., Lin, S.Y., Chiou, S.H., Li, M.J., Chang, T.J., and Hung, S.C.
- Source
- Full text @ PLoS One
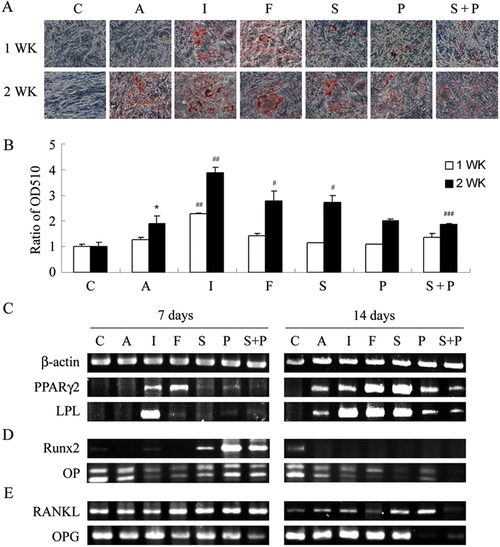
PKA modulators influence adipogenesis, gene expression for adipogenesis, osteogenesis and osteoclast-inducing factors in KP-MSCs. (A) Enhancement of adipogenesis by IBMX, forskolin and Sp-cAMP. Cells were treated in complete growth medium [C] or in adipocyte induction medium without [A] or with the indicated modulator of PKA activity [I: IBMX (0.45 mM), F: forskolin (100 μM), S: Sp-cAMP (11 μM), P: PKI (20 μM), S+P: Sp-cAMP+PKI] for 7 and 14 days. Differentiated adipocytes were detected by the accumulation of lipids, which were stained with Oil Red O. (B) Oil Red O staining as OD510. The results displayed in the bar graphs are quantitative analytic data from three independent experiments and are presented as the meanSD values. Each ratio was normalized to the control, and significance was determined by Student's t-test. (* p<0.05 versus C; # p<0.05, # #<0.01 versus A, # # # p<0.05 versus S). RT-PCR analysis of gene expression of makers for adipogenesis (C), osteogenesis (D), and osteoclast-inducing factors (E) after treatment with PKA modulators. |
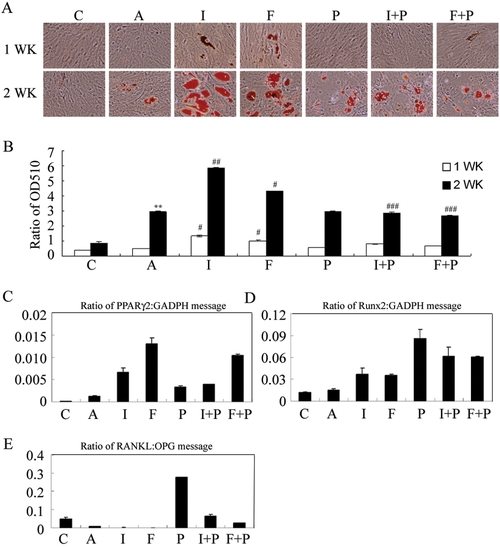
PKA modulators influence adipogenesis, gene expression for adipogenesis, osteogenesis and osteoclast-inducing factors in primary MSCs. (A) Enhancement of adipogenesis by IBMX and forskolin. Cells were treated in complete growth medium [C] or in adipocyte induction medium without [A] or with the indicated modulator of PKA activity [I: IBMX (0.45 mM), F: forskolin (100 μM), P: PKI (20 μM), I+P: IBMX+PKI, F+P: forskolin+PKI] for 7 and 14 days. Differentiated adipocytes were detected by the accumulation of lipids, which were stained with Oil Red O. (B) Oil Red O staining as OD510. The results displayed in the bar graphs are quantitative analytic data from three independent experiments and are presented as the meanSD values. Each ratio was normalized to the control, and significance was determined by Student's t-test. (** p<0.01 versus C; # p<0.05, # #<0.01 versus A, # # # p<0.05 versus I or F). Real-Time RT-PCR analysis of the gene expression ratio of PPARγ2/GADPH (C), Runx2/GADPH (D), and RANKL/OPG (E) after treatment with PKA modulators for 7 days. |
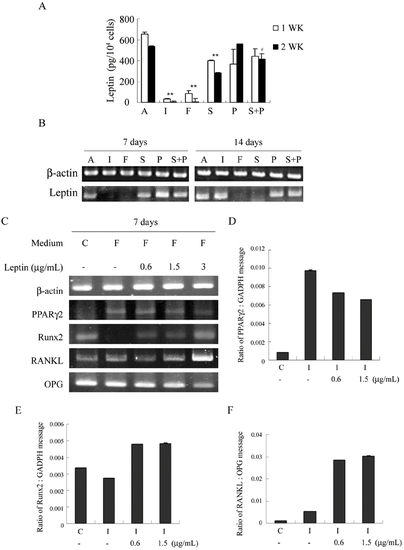
PKA stimulators regulate gene expression for adipogenesis, osteogenesis and osteoclast-inducing factors by suppressing leptin. (A,B) Suppression of leptin secretion and transcription by IBMX, forskolin and Sp-cAMP. Cell treatments were the same as Fig. 1. (A) Leptin concentrations in the conditioned medium of the last 2 days were measured by ELISA and normalized by cell numbers. The figure shows representative data from two independent experiments with three replicates for each condition; data are presented as the meanSD values, and significance was determined by Student's t-test. (**<0.01 versus A; #<0.05 versus S) (B) RT-PCR analysis of mRNA for leptin and β-actin. (C) Exogenous leptin inhibits forskolin-induced effects on gene expression of PPARγ2 and Runx2 and the RANKL/OPG gene expression ratio. Cells were cultured in complete growth medium [C] or treated in AIM with 100 μM forskolin [F] in the absence or presence of leptin (0.6, 1.5, 3 μg/ml) for 7 days. RT-PCR analysis for β-actin, PPARγ2, Runx2, RANKL and OPG. Real-Time RT-PCR analysis of the gene expression ratio of PPARγ2/GADPH (D), Runx2/GADPH (E), and RANKL/OPG. (F). Exogenous leptin inhibits the effects of AIM with IBMX (I: AIM with 0.45 mM IBMX) on gene expression of PPARγ2, Runx2 and the RANKL/OPG gene expression ratio. |
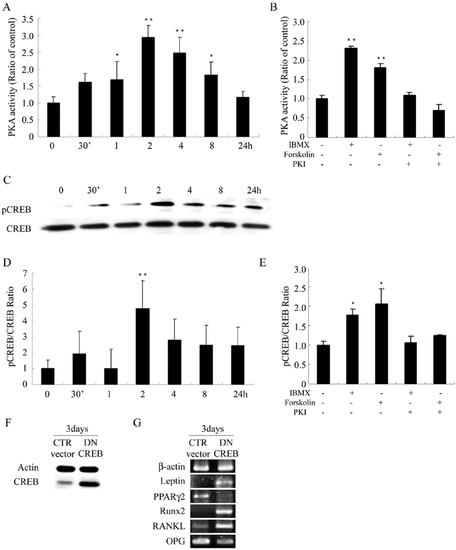
PKA stimulators increase phosphorylation of CREB to regulate gene expression of leptin, PPARγ2 and Runx2 and the RANKL/OPG ratio. Cells were treated in AIM with IBMX (0.45 mM) after serum starvation for 48 hours. (A) PKA activity increased immediately and reached the peak at 2 hours and gradually returned to the baseline at 24 hours. (B) Cells were treated in AIM with different combinations of IBMX (0.45 mM), forskolin (100 μM), and PKI (20 μM), and PKA activities were measured at 2 hours after treatment. (C,D) The same experiment of (A). Level of CREB phosphorylation was indicated as ratio of pCREB/CREB protein level. (E) The same experiment of (B) Levels of CREB phosphorylation were measured at 2 hours after treatment. Data are presented as the mean±SD values of three separate experiments, and significance was determined by Student's t-test. (* p<0.05, ** p<0.01 versus the baseline). (F,G) Suppression of forskolin-induced modulation of gene expression of leptin, PPARγ2, Runx2, RANKL and OPG by transfection with DN CREB. Cells were transfected with control (pcDNA3) or DN CREB vector for 48 hours, followed by treatment in AIM with forskolin (100 μM) for 3 days. (F) Western blot analysis of CREB protein in the transfected cells. (G) RT-PCR analysis of gene expression in transfected cells. Transfection with DN CREB abrogated forskolin-induced block of leptin expression, initiation of PPARγ2 expression, and inhibition of Runx2 expression, and increased the ratio of RANKL/OPG gene expression. |
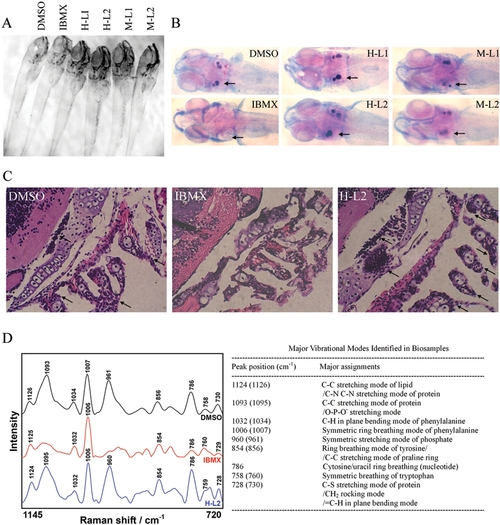
Leptin abrogates IBMX-induced lack of skeletal ossification in developing zebrafish. Embryos were treated in vehicle DMSO, IBMX (0.045 mM), and IBMX with human [H] or mouse [M] leptin (L1: 0.6 μg/mL, L2: 1.5 μg/mL) at 2 dpf. (A) Morphology of embryos at 8 dpf. (B) Alizarin Red S and alcian blue staining of whole zebrafish reveals normal skeletal ossification in DMSO-treated embryos at otolith (arrow), while absent skeletal ossification is evident in IBMX-treated embryos. The addition of human and mouse leptin both in low and high concentrations abrogates IBMX-induced absence of skeletal ossification. (C) Hematoxylin-and-eosin staining of zebrafish sections reveals impaired bone development in IBMX-treated embryos. Arrows indicate bone development with cell aggregation at otolith and pharyngeal arches. (D) Raman microspectroscopic analysis of bone development at otolith in zebrafish. |