- Title
-
The stress responsive gene ankrd1a is dynamically regulated during skeletal muscle development and upregulated following cardiac injury in border zone cardiomyocytes in adult zebrafish
- Authors
- Boskovic, S., Marin Juez, R., Stamenkovic, N., Radojkovic, D., Yr Stainier, D., Kojic, S.
- Source
- Full text @ Gene
|
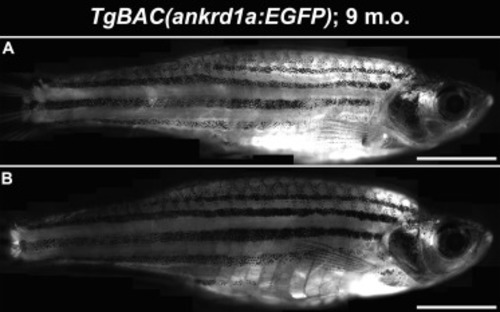
TgBAC(ankrd1a:EGFP) is expressed in the trunk and head muscles during larval development. Brightfield (A, B) and fluorescence images (A?, B?, C-G) of embryos and larvae at indicated developmental stages; lateral views. Yellow arrows in F-G indicate presumed cranial and trunk interneuromast cells. Transverse sections of the trunk at 22 hpf (H) and 96 hpf (I). Green arrows in H point to the horizontal myoseptum. Scale bars, 100 Ám for A-A? and B-B?, 200 Ám for C-G, 50 Ám for H-I. hpf - hours post fertilization. (For interpretation of the references to color in this figure legend, the reader is referred to the web version of this article.) |
|
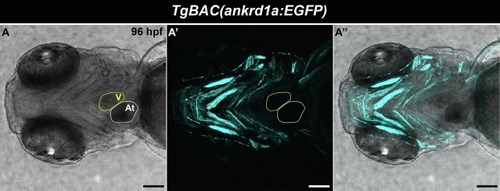
TgBAC(ankrd1a:EGFP) expression is detected in the trunk and head slow muscle cells. 96 hpf larvae were immunostained with anti-EGFP (cyan) and F310 (fast muscle fibers, magenta) antibodies. (A-A??) Confocal scans of the trunk region shown as separate channels (A, A?) and merged image (A??). (B) 3D reconstruction of the trunk area. (C, D) Lateral (C) and ventral (D) views of the head. Arrows on C and D point to positions of optical cross sections of specified muscles, shown in E-H and I-L respectively. (E-L) Optical cross sections of individual head muscles, designated as: lap = levator arcus palatini, do = dilator operculi, ao = adductor operculi, bl5 = branchial levator 5, imp = intermandibularis posterior, am = adductor mandibulae, ih = interhyoideus and sh = sternohyoideus. In panels E-L, arrows point to regions of signal overlap (yellow color). Scale bars, 100 Ám. (For interpretation of the references to color in this figure legend, the reader is referred to the web version of this article.) |
|
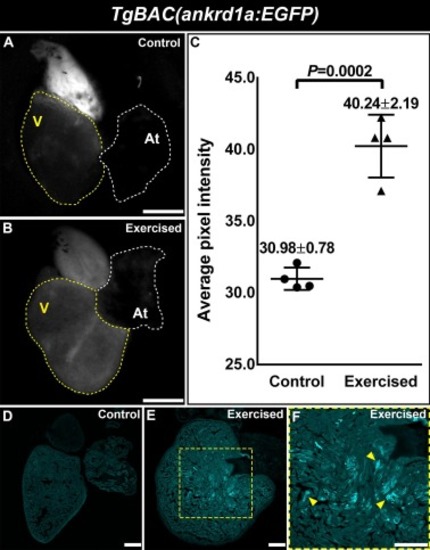
Exercise upregulates TgBAC(ankrd1a:EGFP) expression in the heart of adult zebrafish. (A, B) Fluorescence images of control and exercised hearts. Atrial (At) and ventricular (V) chambers are delineated by white and yellow dotted lines, respectively. (C) EGFP signal was quantified in control and exercised hearts (n = 4) and presented as average pixel intensity ▒ SD. (D, E) Representative images of cryosections of control and exercised hearts. (F) Magnified area from E, yellow arrows point to cells with pronounced transgene expression. Scale bars, 500 Ám for A and B, 100 Ám for D to F. (For interpretation of the references to color in this figure legend, the reader is referred to the web version of this article.) |
|
ankrd1a is upregulated in the injury border zone of cryoinjured ventricles. (A) In situ hybridization was used to detect ankrd1a transcript in cryoinjured adult zebrafish heart at 3 dpci. Yellow dotted line delineates the injury border. (A?) Magnified region from (A). Zone of ankrd1a upregulation is marked with brackets. (B) Expression level of ankrd1a was quantified by RT-qPCR at 1 and 7 dpci and expressed as relative to sham-operated controls (1 and 7 days post sham (dps), average values set to 1). Results are presented as mean ▒ SD. Average Ct values are given in Supplemental table 3. FC = fold change. (For interpretation of the references to color in this figure legend, the reader is referred to the web version of this article.) |
|
TgBAC(ankrd1a:EGFP) is highly expressed in cardiomyocytes at the cryoinjury border zone. Hearts of TgBAC(ankrd1a:EGFP);Tg(-0.8myl7:nls-DsRedExpress) zebrafish were injured and left to recover for 3 and 7 days. (A, B) Images of whole hearts reveal localization of EGFP+ positive cells at the border with injured tissue. (C, D) Cryosections of injured hearts at 3 and 7 dpci. Yellow and white dotted lines outline the zones of EGFP+ cells. Average thickness ▒ SD of these zones is displayed in the lower left corner of each panel. (E, F) Higher magnification of injury border zone at 3 and 7 dpci. (E?, F?) Higher magnification of areas from E and F, showing injury border zone CMs. Yellow arrows point to EGFP+/nls-DsRedExpress+ and white arrows point to EGFP-/nls-DsRedExpress+ CMs. Scale bars, 100 Ám. (For interpretation of the references to color in this figure legend, the reader is referred to the web version of this article.) |
|
|
|
|
|
|
|
|
|
|
Reprinted from Gene, 792, Boskovic, S., Marin Juez, R., Stamenkovic, N., Radojkovic, D., Yr Stainier, D., Kojic, S., The stress responsive gene ankrd1a is dynamically regulated during skeletal muscle development and upregulated following cardiac injury in border zone cardiomyocytes in adult zebrafish, 145725, Copyright (2021) with permission from Elsevier. Full text @ Gene


