- Title
-
Functionally distinct Purkinje cell types show temporal precision in encoding locomotion
- Authors
- Chang, W., Pedroni, A., Hohendorf, V., Giacomello, S., Hibi, M., Köster, R.W., Ampatzis, K.
- Source
- Full text @ Proc. Natl. Acad. Sci. USA
|
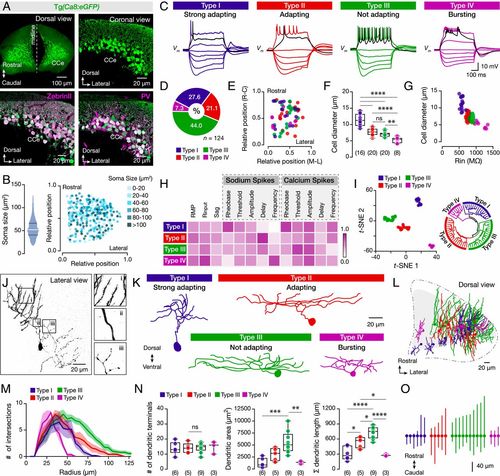
Diverse cellular, firing, and morphological properties of the adult zebrafish Purkinje cells. (A) Specific expression of eGFP in all Purkinje cells of brains from the Tg(Ca8:eGFP) line. All eGFP-expressing Purkinje cells (green) are ZebrinII and PV positive (magenta). (B) Quantification and intermingle distribution of the Purkinje cells soma size. (C) The Purkinje cells display distinct firing patterns. Black trace shows the response at the rheobase. (D) Differential representation of the Purkinje cell types in the adult zebrafish cerebellum. (E) Purkinje cell types in the CCe lack topographic organization. Axes represent the normalized distances of the midline, lateral, rostral, and caudal edges of the CCe. (F) Purkinje cell types have significantly different soma sizes (P < 0.0001, one-way ANOVA/Tukey’s post hoc test). (G) Correlation between soma size and input resistance (Rin) segregates the different Purkinje cell types. (H) Normalized mean values of the electrical properties observed for the Purkinje cell types that are detailed described in SI Appendix, Fig. S4. Normalizations were performed for each property to the highest obtained value. (I, Left) t-SNE plot depicting clusters of the Purkinje cells based on the electrophysiological properties of the dataset as in H and SI Appendix, Fig. S4. (I, Right) Fan (polar) shaped hierarchical clustering dendrogram of the electrophysiological data yielded similar results to t-SNE. All cells and data colored by assigned cell type. (J) Reconstructed neurobiotin-filled Purkinje cell showing the common morphological features for all Purkinje cell types. (i) Distal dendrites with spines. (ii) Proximal spineless dendrites. (iii) Axonal collaterals. (K) Reconstructed neurobiotin-filled Purkinje cells are showing the morphology of each type. (L) Dorsal view of the cerebellum (CCe) showing the three-dimensional intermingled distribution of the distinct types of Purkinje dendrites. (M) Sholl analysis of dendritic complexity with increasing radial distance from the soma center for each Purkinje cell type. The solid lines represent the mean of the intersections while the shades refer to the SEM. (N) Analysis of dendritic trees on each Purkinje cell type. (O) Plot illustrating the Purkinje cell soma and the rostro-caudal distribution of the dendrites obtained from the dorsal view reconstructions. The lines represent the maximum and minimum rostrocaudal position. All Purkinje cells are aligned based on their soma (solid circles). CCe, corpus cerebelli; PV, Parvalbumin; RMP, resting membrane potential; Rinput, input resistance. Data are presented as box plots or violin plots showing the median with 25/75 percentile (box and line) and minimum–maximum (whiskers). **P < 0.05; **P < 0.01; ***P < 0.001; ****P < 0.0001; ns, not significant. For detailed statistics, see SI Appendix, Table S1. |
|
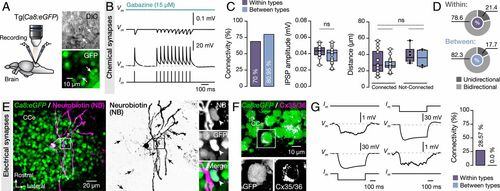
Synaptic interactions between adult zebrafish Purkinje cells. (A) Ex vivo setup of isolated intact brain from Tg(Ca8:eGFP) line allows simultaneous dual recordings of Purkinje cells. Arrows indicate the recorded cells. (B) Representative average (from ∼40 sweeps) sample traces from paired Purkinje cell recordings show small but robust monosynaptic IPSPs. All IPSPs were blocked by applying selective GABAA receptor antagonist gabazine (15 μM). (C) Quantification of the observed connectivity between Purkinje cells (Connected: within types, 14 of 20; between types, 17 of 21). Quantification of the connectivity strength (IPSP amplitude) and the relative distance between connected and not-connected pairs of Purkinje cells were all not significant regardless of type. (D) Proportions of unidirectional and bidirectional connections between Purkinje cells of the same type (Within) and different type (Between). (E) Single Purkinje cell neurobiotin injection (magenta) in Ca8:GFP line (green) resulted in dye coupling of other Purkinje cells (black arrows). Arrowheads indicate a dye coupled neuron (NB+) as Purkinje cell (GFP+). (F) Detection of Cx35/36 puncta (magenta) on Purkinje cell bodies (green). In Inset, a magnification of a representative example of Purkinje cell soma (GFP+) decorated with connexins puncta (Cx35/36). (G) Sample recordings showing bidirectional electrical coupling only in chemically connected Purkinje cells of the same type (4 of 14 connected pairs). CCe, corpus cerebelli; Cx, connexin; DIC, Differential interference contrast; GFP, green fluorescent protein; IPSP, inhibitory postsynaptic potential. Data are presented as box plots showing the median with 25/75 percentile (box and line) and minimum–maximum (whiskers). ns, not significant. For detailed statistics, see SI Appendix, Table S1. |
|
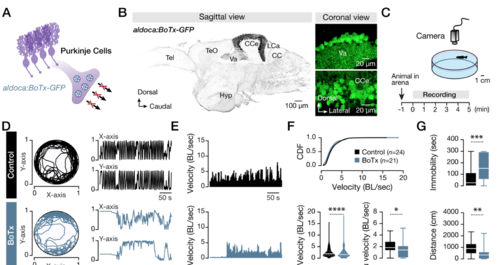
Adult zebrafish Purkinje cell silencing disrupts locomotor performance. (A) A transgenic animal line in which all and only the Purkinje cells encode Botulinum toxin (BoTx) was used. (B) Sagittal view of the adult zebrafish brain showing the specificity of the transgenic zebrafish line. Microphotographs acquired from the adult zebrafish valvula (Va) and corpus (CCe) cerebelli showing the expression of the BoTx (GFP+; green) in the Purkinje cell population. (C) Experimental setup for recording and evaluating the adult zebrafish locomotor behavior under an open field test. (D) Sample traces of recorded movements of control (WT; black) and BoTx (aldoca:BoTx-GFP; Cyan) zebrafish, followed by an analysis of the body displacement with respect to X and Y axis during the open field test (duration 5 min). The BoTx animals exhibited erratic locomotion compared to the smooth movements observed in the control animals. (E, F) Traces and analysis of normalized velocity show that silencing Purkinje cells in aldoca:BoTx-GFP (Cyan) causes slow locomotion (velocity: P<0.0001, unpaired t-test; average velocity: P=0.045, unpaired t- test) during the open field test. (G) Quantification of the swimming parameters showing that the immobility time (P=0.001, unpaired t-test), and the total distance traveled (P=0.007, unpaired t- test), were significantly different between the control (black) and the aldoca:BoTx-GFP (Cyan) animals. BoTx, Botulinum toxin; CC, crista cerebellaris; CCe, corpus cerebelli; CDF, cumulative distribution frequencies; Hyp, hypothalamus; LCa, lobus caudalis cerebelli; Tel, telencephalon; TeO, tectum opticum; Va, valvular cerebelli; μ, mean. Data are presented as box or violin plots showing the median with 25/75 percentile (box and line) and minimum–maximum (whiskers). *P<0.05; **P<0.01; ***P<0.001; ****P<0.0001; ns, not significant. For detailed statistics, see SI Appendix, Table S1. |
|
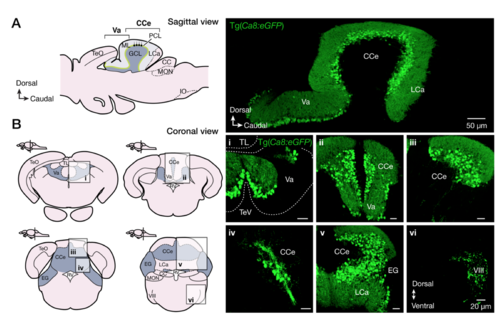
Expression pattern of Ca8:eGFP in the adult zebrafish brain. (A-B) Sagittal and coronal sections are showing the specificity of the eGFP expression in all Purkinje cells (green) of the adult zebrafish cerebellum. CC, crista cerebellaris, CCe, corpus cerebelli; EG, eminentia granularis; GCL, granule cell layer; IO, oliva inferior; LCa, lobus caudalis cerebelli; ML, molecular layer; MON, medial octavolateralis nucleus; PCL, Purkinje cell layer; RV, rhombencephalic ventricle; TeO, tectum opticum; Tev, tectal ventricle; Va, valvular cerebelli; VIII, octaval nerve. |
|
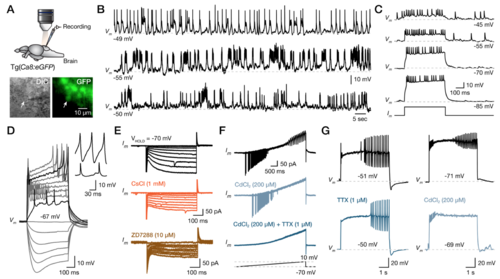
Common physiological properties of the Purkinje cells. (A) Ex-vivo setup of an isolated intact brain from the Tg(Ca8:eGFP) line allows whole-cell patch-clamp recordings of Purkinje cells. Arrows indicate the recorded cell. (B) Sample traces showing the intense and variable spontaneous activity of three different Purkinje cells recorded in the adult zebrafish cerebellum. (C) Application of a bias hyperpolarization current eliminates the spontaneous activity without affecting the Purkinje cell firing pattern induced by a depolarized current step injection. (D) Step current injections reveal the common Purkinje cell properties (sag potential, sodium spikes, calcium spikes). Magnification of the calcium-based (top) and sodium-based (bottom) spikes showing noticeable differences in the amplitude and duration. (E) Voltage-clamp recordings show inward current reduced by Ih blockers (CsCl, ZD7288). (F) Voltage-clamp ramp recordings show sodium (blocked by TTX) and calcium (blocked by CdCl2) spikes. (G) Current-clamp recordings show the elimination of the sodium spikes after the application of TTX and the calcium spikes with CdCl2. CdCl2, calcium chloride; CsCl, cesium chloride; DIC, differential interference contrast; GFP, green fluorescent protein; TTX, tetrodotoxin. |

