
|
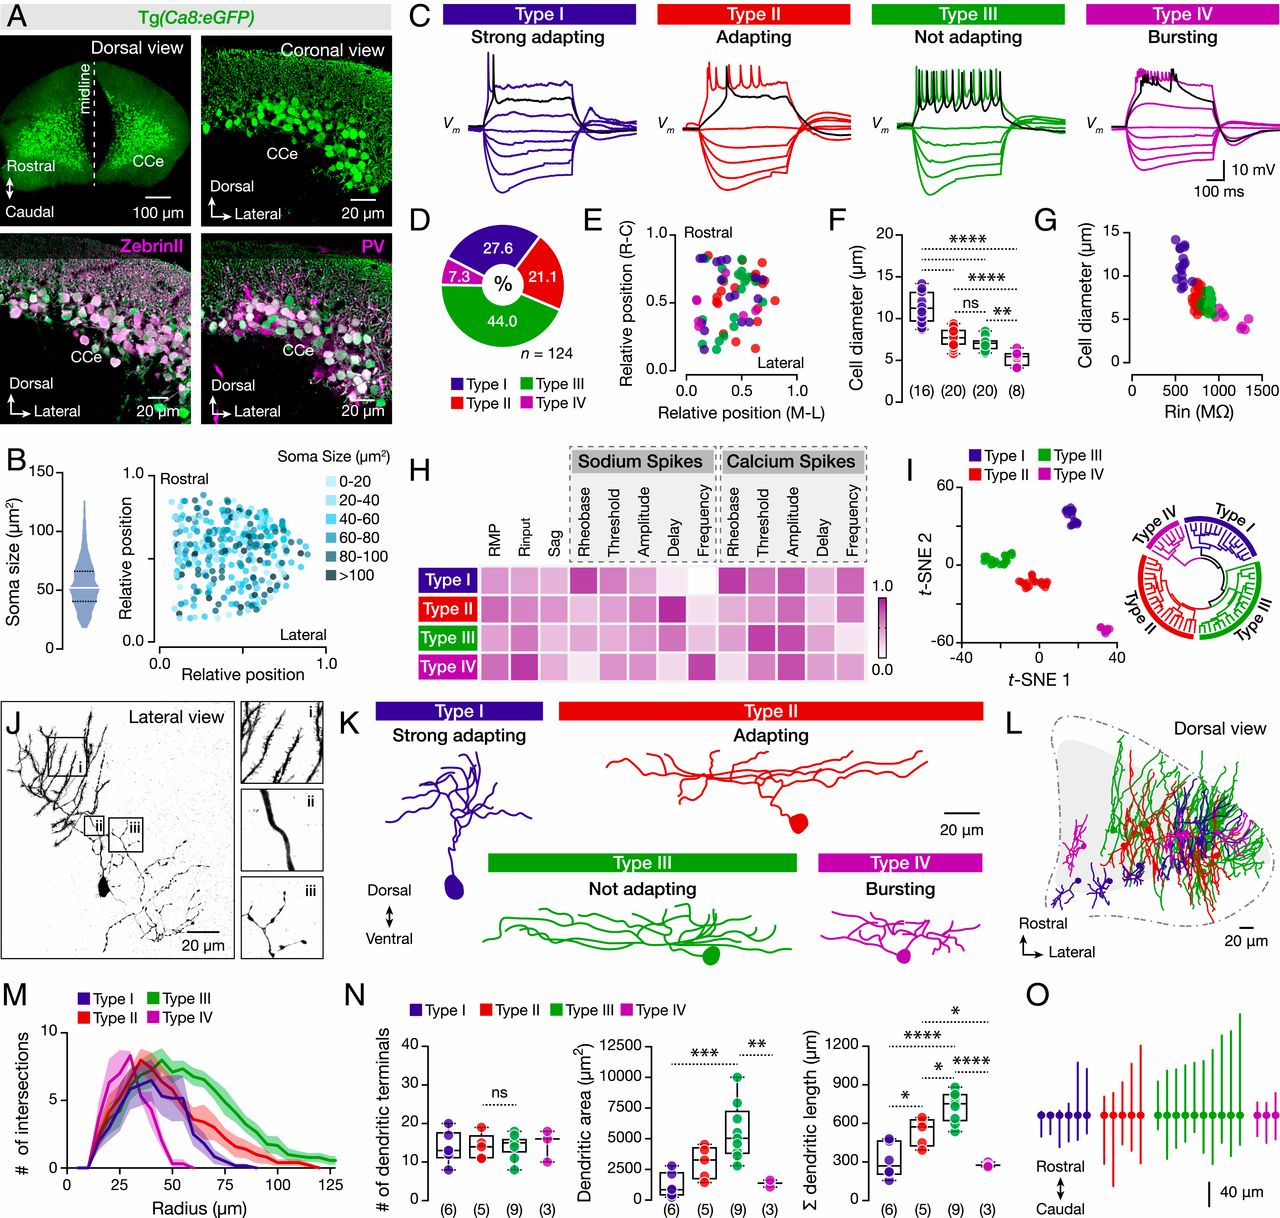
Fig. 1
Diverse cellular, firing, and morphological properties of the adult zebrafish Purkinje cells. (A) Specific expression of eGFP in all Purkinje cells of brains from the Tg(Ca8:eGFP) line. All eGFP-expressing Purkinje cells (green) are ZebrinII and PV positive (magenta). (B) Quantification and intermingle distribution of the Purkinje cells soma size. (C) The Purkinje cells display distinct firing patterns. Black trace shows the response at the rheobase. (D) Differential representation of the Purkinje cell types in the adult zebrafish cerebellum. (E) Purkinje cell types in the CCe lack topographic organization. Axes represent the normalized distances of the midline, lateral, rostral, and caudal edges of the CCe. (F) Purkinje cell types have significantly different soma sizes (P < 0.0001, one-way ANOVA/Tukey’s post hoc test). (G) Correlation between soma size and input resistance (Rin) segregates the different Purkinje cell types. (H) Normalized mean values of the electrical properties observed for the Purkinje cell types that are detailed described in SI Appendix, Fig. S4. Normalizations were performed for each property to the highest obtained value. (I, Left) t-SNE plot depicting clusters of the Purkinje cells based on the electrophysiological properties of the dataset as in H and SI Appendix, Fig. S4. (I, Right) Fan (polar) shaped hierarchical clustering dendrogram of the electrophysiological data yielded similar results to t-SNE. All cells and data colored by assigned cell type. (J) Reconstructed neurobiotin-filled Purkinje cell showing the common morphological features for all Purkinje cell types. (i) Distal dendrites with spines. (ii) Proximal spineless dendrites. (iii) Axonal collaterals. (K) Reconstructed neurobiotin-filled Purkinje cells are showing the morphology of each type. (L) Dorsal view of the cerebellum (CCe) showing the three-dimensional intermingled distribution of the distinct types of Purkinje dendrites. (M) Sholl analysis of dendritic complexity with increasing radial distance from the soma center for each Purkinje cell type. The solid lines represent the mean of the intersections while the shades refer to the SEM. (N) Analysis of dendritic trees on each Purkinje cell type. (O) Plot illustrating the Purkinje cell soma and the rostro-caudal distribution of the dendrites obtained from the dorsal view reconstructions. The lines represent the maximum and minimum rostrocaudal position. All Purkinje cells are aligned based on their soma (solid circles). CCe, corpus cerebelli; PV, Parvalbumin; RMP, resting membrane potential; Rinput, input resistance. Data are presented as box plots or violin plots showing the median with 25/75 percentile (box and line) and minimum–maximum (whiskers). **P < 0.05; **P < 0.01; ***P < 0.001; ****P < 0.0001; ns, not significant. For detailed statistics, see SI Appendix, Table S1.