
- Title
-
Next Generation Sequencing and Animal Models Reveal SLC9A3R1 as a New Gene Involved in Human Age-Related Hearing Loss
- Authors
- Girotto, G., Morgan, A., Krishnamoorthy, N., Cocca, M., Brumat, M., Bassani, S., La Bianca, M., Di Stazio, M., Gasparini, P.
- Source
- Full text @ Front Genet
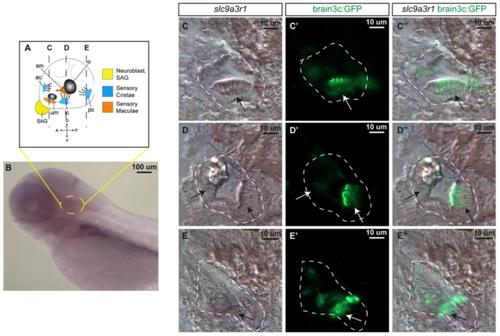
slc9a3r1 expression analysis by in situ hybridization (ISH). (A) Schematic of 5 dpf inner ear cellular organization. The position of transversal views (C–E) is outlined by dotted lines. (B) Lateral view of the anterior region of the 5 dpf larvae. Yellow circle delimits the inner ear location. (C,C’,C”) Transversal view of the anterior region of the inner ear. The inner ear is outlined by a white dotted line. Arrows point to hair cell patches location. (C) slc9a3r1 ISH. (C’) brain3c:GFP. (C”) slc9a3r1 and brain3c:GFP merged image. (D,D’,D”) Transversal view of the medial region of the inner ear. The inner ear is outlined by a white dotted line. Arrows point to hair cell patches location. (D) slc9a3r1 ISH. (D’)brain3c:GFP. (D”) slc9a3r1 and brain3c:GFP merged image. (E,E’,E”) Transversal view of the posterior region of the inner ear. The inner ear is outlined by a white dotted line. Arrows point to hair cell patches location. (E) slc9a3r1 ISH. (E’) brain3c:GFP. (E”) slc9a3r1 and brain3c:GFP merged image. EXPRESSION / LABELING:
|
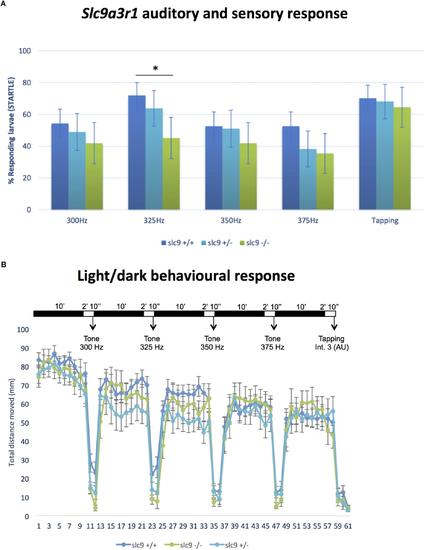
Auditory/sensory response and light/dark behavioral response in Zebrafish larvae. (A) Response of slc9a3r1 KI animals compared to the wild-type ones to all the different sound stimuli tested (number of tested animals: slc9a3r1+/+ N = 57, slc9a3r1+/- N = 47, slc9a3r1R180Q/R180Q N = 31). Statistically significant difference indicated with “*” (∗p-value < 0.05). (B) Behavior and response activity to visual stimuli of slc9a3r1R180Q/R180Q compared to slc9a3r1+/+ and slc9a3r1+/-. Tapping intensity is indicated as arbitrary unit (AU). PHENOTYPE:
|
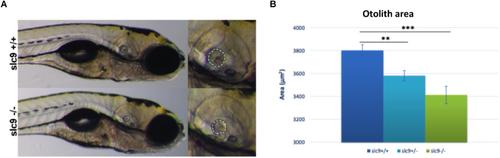
Measurement of the otolith size. (A) Measurement of the posterior otolith in slc9a3r1+/+ and slc9a3r1R180Q/R180Qlarvae. (B) Measurement of posterior otolith area of slc9ar1larvae (number of tested animals: slc9a3r1+/+ N = 57, slc9a3r1+/-N = 70, slc9a3r1R180Q/R180Q N = 32). ∗∗p-value < 0.005 and ∗∗∗p-value < 0.0005 PHENOTYPE:
|
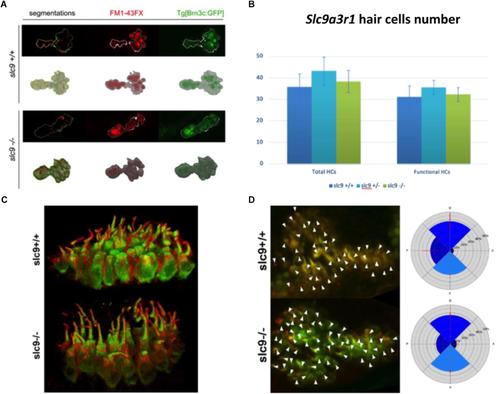
Hair cells number, morphology and orientation in Zebrafish larvae. (A) 3D reconstruction of the saccular macula. Hair cells are marked with GFP. FM1-43FX dye labels only mature and fully functional hair cells. (B) Saccular hair cells count in slc9a3r1 larvae (number of tested animals: slc9a3r1+/+N = 9, slc9a3r1+/- N = 10, slc9a3r1R180Q/R180Q N = 6). (C) 3D reconstruction of the saccular hair cell layer. brn3c:mGFP signal labels the membrane of the hair cells while red signal labels the kinocilia. (D) Hair cell polarization within the saccular macula of slc9a3r1 KI and their wt siblings. |
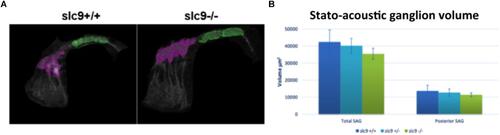
Stato-acoustic ganglion (SAG) characterization. (A)3D reconstruction of the SAG in slc9a3r1 KI and their WT siblings (number of tested animals: slc9a3r1+/+ N = 3, slc9a3r1+/-N = 6, slc9a3r1R180Q/R180Q N = 6). The anterior part of the SAG is depicted in pink, while in green is indicated the posterior part which innervates the saccular macula and it is related to the auditory function. (B) The graph shows the total SAG volume (volume of the pink and green area) and the volume of the posterior SAG of slc9a3r1 animals. Although small differences (not statistically significant) no alterations were observed in the volume of the posterior stato-acoustic ganglion. PHENOTYPE:
|