
IMAGE
Fig. 4
- ID
- ZDB-IMAGE-201028-1
- Publication
- Girotto et al., 2019 - Next Generation Sequencing and Animal Models Reveal SLC9A3R1 as a New Gene Involved in Human Age-Related Hearing Loss
- All Figures
- Figures for Girotto et al., 2019
Image
|
Figure Caption
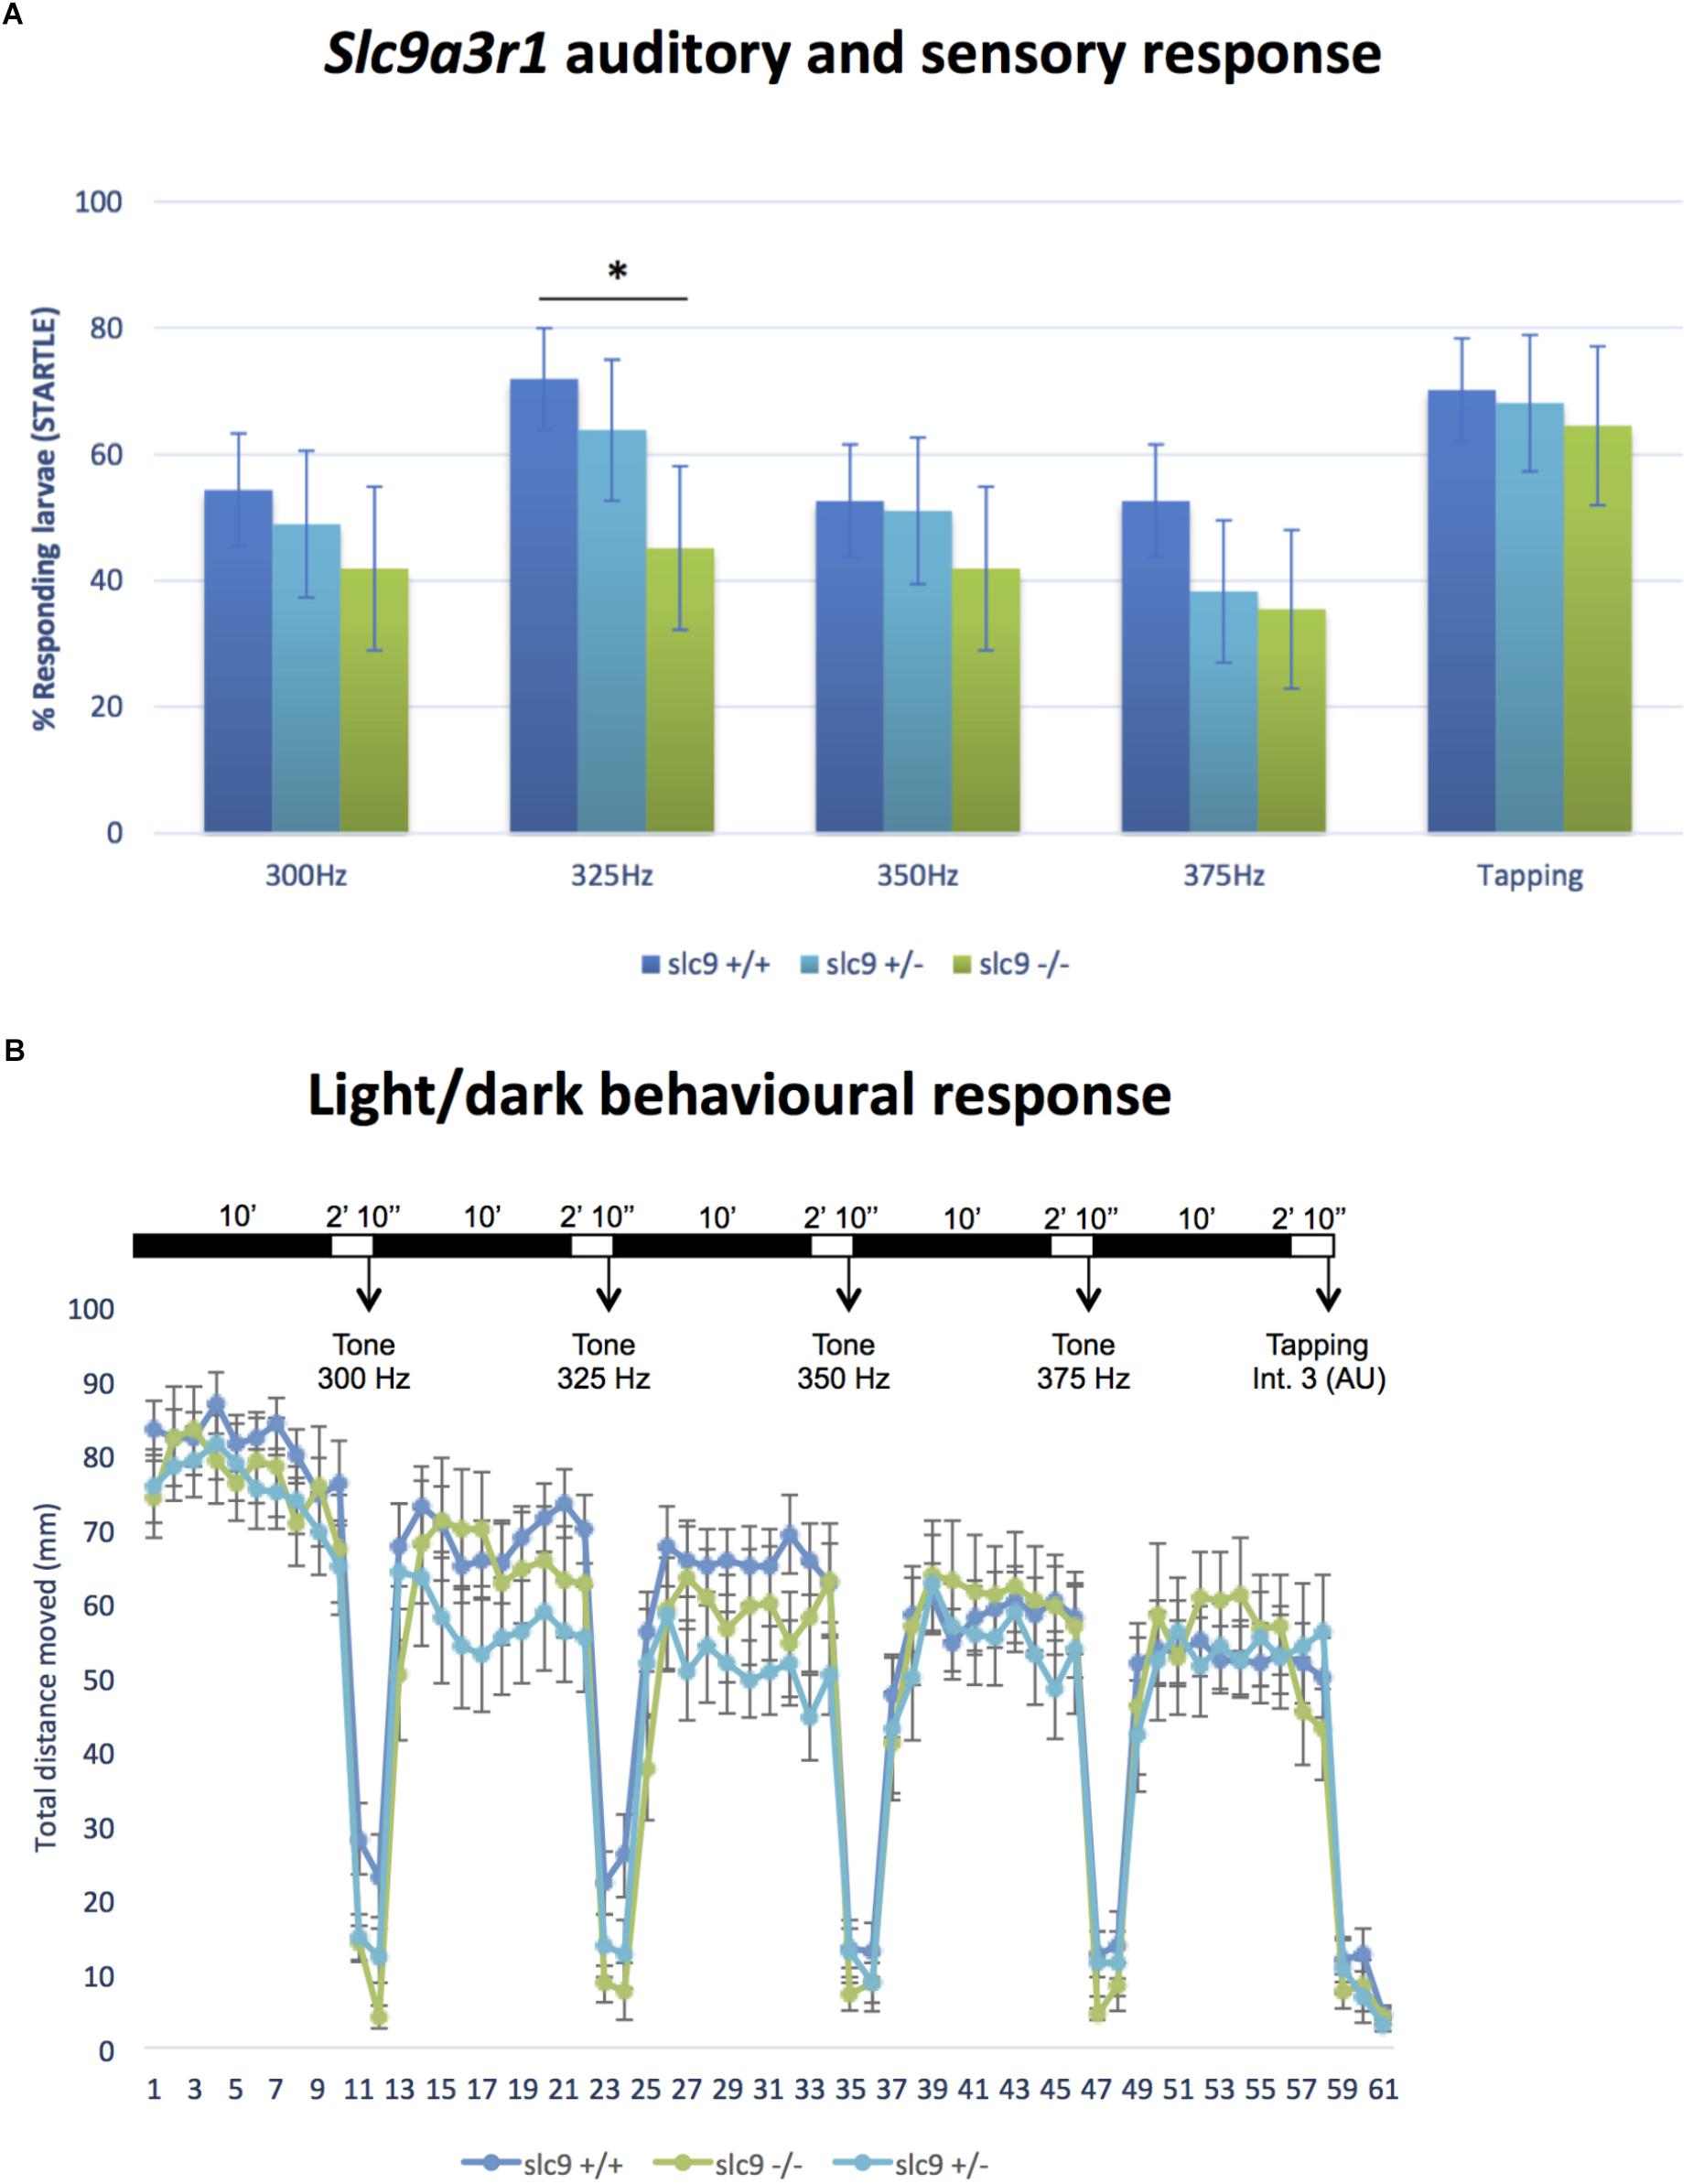
Fig. 4 Auditory/sensory response and light/dark behavioral response in Zebrafish larvae. (A) Response of slc9a3r1 KI animals compared to the wild-type ones to all the different sound stimuli tested (number of tested animals: slc9a3r1+/+ N = 57, slc9a3r1+/- N = 47, slc9a3r1R180Q/R180Q N = 31). Statistically significant difference indicated with “*” (∗p-value < 0.05). (B) Behavior and response activity to visual stimuli of slc9a3r1R180Q/R180Q compared to slc9a3r1+/+ and slc9a3r1+/-. Tapping intensity is indicated as arbitrary unit (AU).
Figure Data
Acknowledgments
This image is the copyrighted work of the attributed author or publisher, and
ZFIN has permission only to display this image to its users.
Additional permissions should be obtained from the applicable author or publisher of the image.
Full text @ Front Genet