
- Title
-
Asymmetry of an Intracellular Scaffold at Vertebrate Electrical Synapses
- Authors
- Marsh, A.J., Michel, J.C., Adke, A.P., Heckman, E.L., Miller, A.C.
- Source
- Full text @ Curr. Biol.
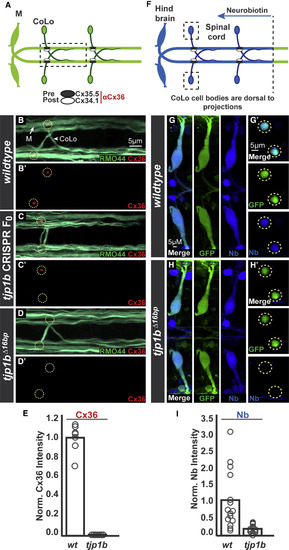
The MAGUK Scaffold Tjp1b Is Required for Electrical Synapse Formation and Function (A) Schematic of the Mauthner circuit in dorsal view with anterior to the left (here and in all figures). Neurons and synapses of the hindbrain, with two of 30 spinal segments, are shown. Mauthner neurons send axons into the spinal cord making electrical synapses (black and white ovals) with commissural locals (CoLos). The M/CoLo synapses require two connexins (Cxs) for formation, presynaptic Cx35.5 (black ovals) and postsynaptic Cx34.1 (white ovals). The boxed line denotes the region of spinal cord shown in (B)–(D). (B–D) Dorsal views of a spinal cord segment from 5-day-post-fertilization zebrafish larvae. Images are maximum-intensity projections of ∼5 μm (here and in all figures, unless otherwise noted) stained for neurofilaments (RMO44, green) and an anti-human-Connexin36 (Cx36, red) that labels both Cx35.5 and Cx34.1 proteins [12]. Neighboring panels show individual Cx36 channels. (B and B′) Wild-type. Mauthner and CoLo neuronal processes, along with other spinal cord neuronal projections, are stained with RMO44. The sites of M/CoLo synaptic contact are noted with dashed yellow circles. (C and C′) Mosaicly mutant CRISPR-injected F0 animals targeting the tjp1b locus. (D and D′) Homozygous tjp1b mutant. (E) Quantification of Cx36 fluorescent intensities in wild-type and tjp1b mutants. Wild-type and mutant are significantly different (p < 0.0001). In this and all other quantifications, an unpaired t test with Welch’s correction was used, unless otherwise noted. (F) Schematic of retrograde labeling of Mauthner axons with the gap junction permeable dye Neurobiotin (Nb) applied from a caudal transection (dotted line). The boxed region denotes the CoLo cell bodies shown in (G′) and (H′). (G and H) Hindbrain (∼15 μm projection; G and H) and spinal cord (G′ and H′) images from M/CoLo:GFP transgenic animals at the level of the cell bodies stained for anti-GFP (green) and Nb (blue). Note that other neurons found near Mauthner in the hindbrain are also filled by the retrograde labeling procedure (Nb signal in non-GFP-expressing cell bodies in G and H). (G and G′) Wild-type M/CoLo:GFP. (H and H′) Homozygous tjp1b mutant in M/CoLo:GFP transgenic background. (I) Quantification of the ratio of Nb in CoLo to Mauthner cell bodies in wild-type and mutant animals. Wild-type and mutant are significantly different (p = 0.002). In (E) and (I), the height of the bar represents the mean of the sampled data with each circle representing the average of 10–16 M/CoLo synapses within an animal. See associated data and statistics in Data S1 and related data in Figure S1. |
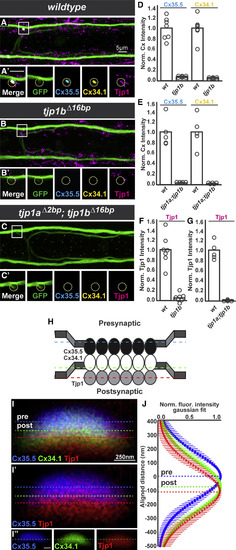
Tjp1b Is Asymmetrically Localized at Electrical Synapses and Required for Pre- and Postsynaptic Cx Localization (A–C) Dorsal-view projections from M/CoLo:GFP larvae stained for anti-GFP (green), anti-zebrafish-Cx35.5 (cyan), anti-zebrafish-Cx34.1 (yellow), and anti-human Tjp1 (magenta). Boxes denote the location of the zooms. (A′–C′) Individual Z-plane zooms. The yellow circle denotes the location of the M/CoLo site of contact. Individual channels are shown in neighboring panels. (A and A′) Wild-type M/CoLo:GFP transgenic. (B–C′) Homozygous tjp1b mutant (B and B′) and homozygous tjp1a; tjp1b double mutant (C and C′) in the M/CoLo:GFP transgenic background. (D–G) Quantification of Cx35.5, Cx34.1 (D and E) and Tjp1 (F and G) fluorescent intensities at M/CoLo synapses of the noted genotypes. In each case, wild-type and mutant are significantly different (p < 0.01 for all comparisons). The height of the bar represents the mean of the sampled data with each circle representing the average of 10–16 M/CoLo synapses within an animal. (H) Model Cx35.5, Cx34.1, and Tjp1 localization at M/CoLo synapses. (I) Wild-type electrical synapse oriented with presynaptic Mauthner at the top and the postsynaptic CoLo at the bottom of the image (cells not shown). Larvae are stained for anti-zebrafish-Cx35.5 (blue), anti-zebrafish-Cx34.1 (green), and anti-human Tjp1 (red). Each dotted line represents the peak of fluorescence intensity of individual channels for a line running vertically across the middle of the synapse. The Cx34.1 channel is removed in (I′) and individual channels are shown in (I″). The dotted line in (I″) represents the peak staining of the Cx34.1 channel. (J) Fluorescent intensities from the Cx35.5, Cx34.1, and Tjp1 channels aligned to the center of the Cx35.5 peak fluorescence. Each point represents the average fluorescence intensity from 35 individual synapses in eight animals at the specified distance away from the Cx35.5 peak fluorescence, with bars representing the SD. The peak-to-peak distance between the Cxs is ∼81 nm, and Tjp1 staining is consistently ∼33 nm further displaced away from Cx35.5. See associated data and statistics in Data S1 and related data in Figures S2 and S3. |
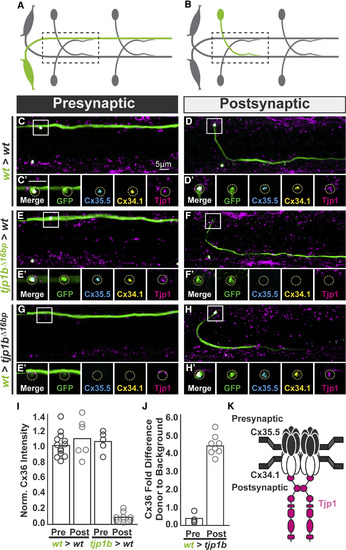
The Exclusive Asymmetric Function of tjp1b Postsynaptically Is Necessary and Sufficient for Electrical Synapse Formation (A and B) Schematics of chimeric larval circuits with the presynaptic Mauthner (A) or postsynaptic CoLo (B) derived from a transgenic donor. The genotype of the donor cell and host varies and is noted on the left of each set of images below. (C–H) Dorsal views of chimeric larvae with GFP-marked cells (green) transplanted from a transgenic donor embryo into an unmarked host. Larvae are stained with anti-zebrafish-Cx35.5 (cyan), anti-zebrafish-Cx34.1 (yellow), and anti-human Tjp1 (magenta). Boxes denote location of single Z-plane zoom images in the ′ panels. (C and D) Control transplants from wild-type (wt) M/CoLo:GFP transgenic into a wild-type host. (E and F) Transplants from tjp1b mutant M/CoLo:GFP transgenic into a wild-type host. (G and H) Transplants from wild-type M/CoLo:GFP transgenic into a tjp1b mutant host. (I and J) Quantification of the ratio of Cx36 at donor-associated synapses to host synapses in chimeric embryos. Removing tjp1b function postsynaptically (I) results in a significant loss of Cx36 staining (p = 0.0002) while providing tjp1b function postsynaptically in a mutant (J) results in a significant restoration of Cx36 staining (p = 0.0005). The height of the bar represents the mean of the sampled data with each circle representing the average of 3–10 transplant-associated M/CoLo synapses within an animal. (K) Molecular model of postsynaptically localized Tjp1b required for asymmetric Cxs at the electrical synapse. Tjp1 may dimerize using its second PDZ domain [23] and thereby cluster Cxs at the synapse. Molecular asymmetry may create functional asymmetry at these synapses. See associated data and statistics in Data S1. EXPRESSION / LABELING:
|
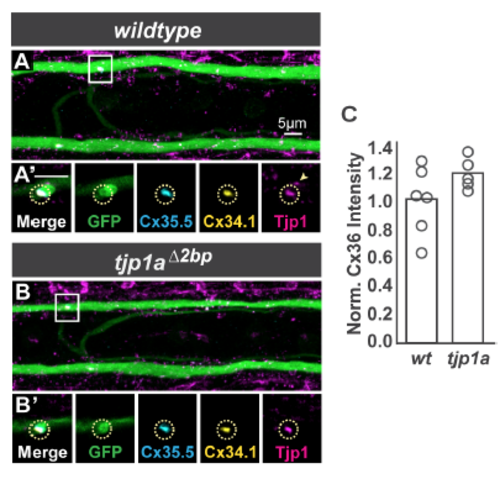
Homozygous loss of tjp1a does not affect electrical synapse formation. Related to Figure 2. A,B. Images are dorsal view projections of ~5 um of a spinal cord segment from M/CoLo:GFP larvae at 5 days post fertilization. Larvae are stained for anti-GFP (green), antizebrafish- Cx35.5 (cyan), anti-zebrafish-Cx34.1 (yellow), and anti-human Tjp1/ZO1 (magenta). Boxes denote location of zooms. A’,B’. Individual Z-plane zooms of indicated region. Yellow circle denotes location of M/CoLo site of contact. Individual channels are shown in neighboring panels. In tjp1a mutants, synaptic Cx and Tjp staining is unaffected (circles) but adjacent nonsynaptic staining (arrowhead in A’) is lost in the mutants (B’). C. Bar graphs represent the mean of Cx36 staining quantified at synapses with each circle representing the average of 11-16 M/CoLo synapses within an animal. See associated data and statistics in Data S1 and related data in Figure 2. |
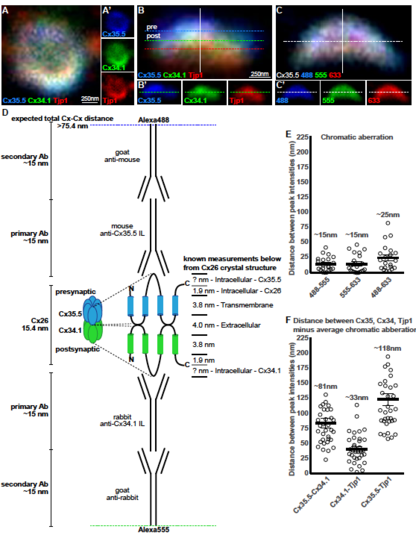
Analysis of presynaptic Cx35.5, postsynaptic Cx34.1, and Tjp1 staining at electrical synapses. Related to Figure 2 A-C. Single plane magnifications of wildtype M/CoLo synapse showing en face (A) and side (B) orientations. In (A,B) larvae are stained for antizebrafish- Cx35.5 (blue, stained with Alexa488), anti-zebrafish-Cx34.1 (green, stained with Alexa555), and anti-human Tjp1 (red, stained with Alexa633). In (A), the presynaptic Mauthner and postsynaptic CoLo are oriented into the page providing an en face view of the synapse, while in (B) Mauthner is at the top and the postsynaptic CoLo at the bottom providing a side view (neurons not shown). Individual channels are shown in neighboring panels. Our localization analysis focused on synapses that were in the side view (B) as these maximized the resolution for observing the pre- and postsynaptic location of staining. C. To measure the chromatic aberration we stained Cx35.5 with secondary antibodies in each dye (Alexa488, 555, and 633) used in localizing each protein of the synapse in (A,B). In (B,C) each dotted line represents the peak of fluorescence intensity for an individual fluorescent channel for the white line running vertically down the middle of the synapse. In (B’) the single dotted line represents the peak fluorescent intensity for only Cx34.1, while in (C’) the single line denotes the peak fluorescent intensity for only the Alexa-555 channel. D. Theoretical Cx-Cx distance expected based on estimated sizes of Cx and antibodies. Known Cx distances are taken from the crystal structure of Cx26[S1]. Note that Cx35.5 and Cx34.1 have longer intracellular loops than Cx26. The Cx35.5 and the Cx34.1 specific antibodies were made against the intracellular loops of each protein[S2]. Antibody lengths are estimated from standard IgG proteins[S3]. E. Estimation of chromatic aberration. Absolute distances between the peak fluorescent intensities of the noted channels from the Cx35.5 as stained in (C). The average measured chromatic aberration is noted. n = 21 individual synapses from 5 animals. F. Distance between the peak fluorescent intensities of the noted proteins as stained in (B). For each, the average chromatic aberration was subtracted to estimate the distance (Cx35.5-Cx34.1/488-555, Cx34.1-Tjp1/555-633, Cx35.5-Tjp1/488-633). The average measured distance between peak staining, minus the chromatic aberration, is noted. n = 35 individual synapses in 8 animals. For (E,F) each point represents the average distance at each individual synapse, with the line representing the average and the bars are standard error. Similar estimations of pre- and postsynaptic localizations have been applied to chemical synapses[S4]. See associated data and statistics in Data S1 and related data in Figure 2. |