
Fig. 2
- ID
- ZDB-FIG-180913-24
- Publication
- Marsh et al., 2017 - Asymmetry of an Intracellular Scaffold at Vertebrate Electrical Synapses
- Other Figures
- All Figure Page
- Back to All Figure Page
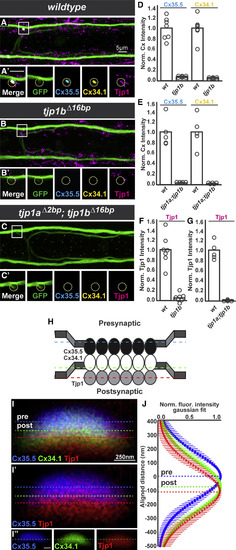
Tjp1b Is Asymmetrically Localized at Electrical Synapses and Required for Pre- and Postsynaptic Cx Localization (A–C) Dorsal-view projections from M/CoLo:GFP larvae stained for anti-GFP (green), anti-zebrafish-Cx35.5 (cyan), anti-zebrafish-Cx34.1 (yellow), and anti-human Tjp1 (magenta). Boxes denote the location of the zooms. (A′–C′) Individual Z-plane zooms. The yellow circle denotes the location of the M/CoLo site of contact. Individual channels are shown in neighboring panels. (A and A′) Wild-type M/CoLo:GFP transgenic. (B–C′) Homozygous tjp1b mutant (B and B′) and homozygous tjp1a; tjp1b double mutant (C and C′) in the M/CoLo:GFP transgenic background. (D–G) Quantification of Cx35.5, Cx34.1 (D and E) and Tjp1 (F and G) fluorescent intensities at M/CoLo synapses of the noted genotypes. In each case, wild-type and mutant are significantly different (p < 0.01 for all comparisons). The height of the bar represents the mean of the sampled data with each circle representing the average of 10–16 M/CoLo synapses within an animal. (H) Model Cx35.5, Cx34.1, and Tjp1 localization at M/CoLo synapses. (I) Wild-type electrical synapse oriented with presynaptic Mauthner at the top and the postsynaptic CoLo at the bottom of the image (cells not shown). Larvae are stained for anti-zebrafish-Cx35.5 (blue), anti-zebrafish-Cx34.1 (green), and anti-human Tjp1 (red). Each dotted line represents the peak of fluorescence intensity of individual channels for a line running vertically across the middle of the synapse. The Cx34.1 channel is removed in (I′) and individual channels are shown in (I″). The dotted line in (I″) represents the peak staining of the Cx34.1 channel. (J) Fluorescent intensities from the Cx35.5, Cx34.1, and Tjp1 channels aligned to the center of the Cx35.5 peak fluorescence. Each point represents the average fluorescence intensity from 35 individual synapses in eight animals at the specified distance away from the Cx35.5 peak fluorescence, with bars representing the SD. The peak-to-peak distance between the Cxs is ∼81 nm, and Tjp1 staining is consistently ∼33 nm further displaced away from Cx35.5. See associated data and statistics in Data S1 and related data in Figures S2 and S3. |
| Genes: | |
|---|---|
| Antibodies: | |
| Fish: | |
| Anatomical Terms: | |
| Stage: | Day 5 |
| Fish: | |
|---|---|
| Observed In: | |
| Stage: | Day 5 |