
Fig. S3
- ID
- ZDB-FIG-180913-27
- Publication
- Marsh et al., 2017 - Asymmetry of an Intracellular Scaffold at Vertebrate Electrical Synapses
- Other Figures
- All Figure Page
- Back to All Figure Page
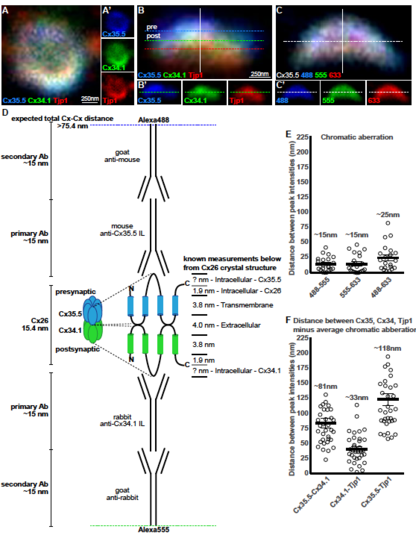
Analysis of presynaptic Cx35.5, postsynaptic Cx34.1, and Tjp1 staining at electrical synapses. Related to Figure 2 A-C. Single plane magnifications of wildtype M/CoLo synapse showing en face (A) and side (B) orientations. In (A,B) larvae are stained for antizebrafish- Cx35.5 (blue, stained with Alexa488), anti-zebrafish-Cx34.1 (green, stained with Alexa555), and anti-human Tjp1 (red, stained with Alexa633). In (A), the presynaptic Mauthner and postsynaptic CoLo are oriented into the page providing an en face view of the synapse, while in (B) Mauthner is at the top and the postsynaptic CoLo at the bottom providing a side view (neurons not shown). Individual channels are shown in neighboring panels. Our localization analysis focused on synapses that were in the side view (B) as these maximized the resolution for observing the pre- and postsynaptic location of staining. C. To measure the chromatic aberration we stained Cx35.5 with secondary antibodies in each dye (Alexa488, 555, and 633) used in localizing each protein of the synapse in (A,B). In (B,C) each dotted line represents the peak of fluorescence intensity for an individual fluorescent channel for the white line running vertically down the middle of the synapse. In (B’) the single dotted line represents the peak fluorescent intensity for only Cx34.1, while in (C’) the single line denotes the peak fluorescent intensity for only the Alexa-555 channel. D. Theoretical Cx-Cx distance expected based on estimated sizes of Cx and antibodies. Known Cx distances are taken from the crystal structure of Cx26[S1]. Note that Cx35.5 and Cx34.1 have longer intracellular loops than Cx26. The Cx35.5 and the Cx34.1 specific antibodies were made against the intracellular loops of each protein[S2]. Antibody lengths are estimated from standard IgG proteins[S3]. E. Estimation of chromatic aberration. Absolute distances between the peak fluorescent intensities of the noted channels from the Cx35.5 as stained in (C). The average measured chromatic aberration is noted. n = 21 individual synapses from 5 animals. F. Distance between the peak fluorescent intensities of the noted proteins as stained in (B). For each, the average chromatic aberration was subtracted to estimate the distance (Cx35.5-Cx34.1/488-555, Cx34.1-Tjp1/555-633, Cx35.5-Tjp1/488-633). The average measured distance between peak staining, minus the chromatic aberration, is noted. n = 35 individual synapses in 8 animals. For (E,F) each point represents the average distance at each individual synapse, with the line representing the average and the bars are standard error. Similar estimations of pre- and postsynaptic localizations have been applied to chemical synapses[S4]. See associated data and statistics in Data S1 and related data in Figure 2. |