- Title
-
Automated phenotype recognition for zebrafish embryo based in vivo high throughput toxicity screening of engineered nano-materials
- Authors
- Liu, R., Lin, S., Rallo, R., Zhao, Y., Damoiseaux, R., Xia, T., Lin, S., Nel, A., and Cohen, Y.
- Source
- Full text @ PLoS One
|
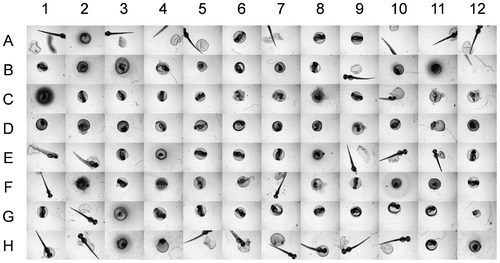
Images captured from a 96-well plate of zebrafish embryos. The embryos were treated with silver nanoparticles of concentration up to 15 mg·L-1. Examples of different phenotypes are: A1, E1, F1, H1′hatched embryos; B1, G1, C1′unhatched embryos; C1, D1, H12′dead embryos. C8, F2, and F7 illustrate images with significant deposits of eNMs. Images with chorion (eggshell) fragments are shown in A5, H7, and H8. Examples of zebrafish that are not completely captured by the imaging system (i.e., only a central portion of the well is imaged) are shown in A4, A7, and A10. |
|
Examples of the three phenotypes and their corresponding image descriptors. (a). Local Edge Histogram for each of 4×4 image blocks (y axis of each of the 4×4 image blocks is from 0 to 6. (b). Representative Color (i.e., the average color (grayscale) for each of the 4×4 image blocks). (c). Color Histogram (x axis is the graryscale that ranges from 0 to 255; y axis is from 0 to 16×104 identifying the number of pixels which grayscale are within the bin range). |
|
Sub-image segments for defining Semi-global edge histograms. The segmentations are corresponding to the typical layouts of zebrafish embryos of the constructed GSEHD descriptor. |
|
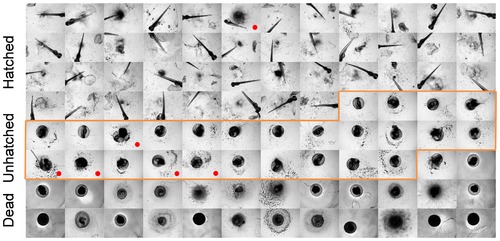
Stress test set composed by 96 images of low quality. Red dot identifies the images that were misclassified (all as “dead” phenotype)). |
|
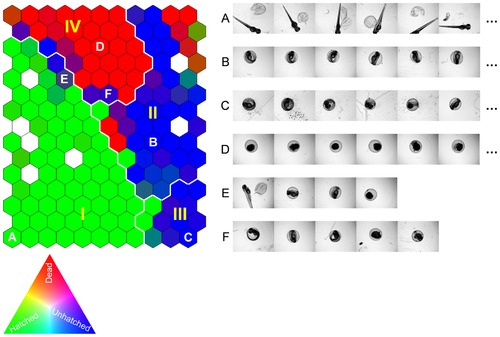
Self-Organizing Map (SOM) of the training image set described by the three selected image descriptors. Similar images are organized as neighbors on the map and clusters I–IV are the four primary clusters identified by SOM analysis. The SOM cells are colored by [R, G, B] = [Ndead, Nhatched, Nunhatched]/N, where Ndead, Nhatched, and Nunhatched identify the number of dead, hatched, unhatched zebrafish embryos grouped into a given cell, respectively, and N = Ndead+Nhatched+Nunhatched. Accordingly, homogeneous SOM cells of hatched, unhatched, and dead zebrafish embryos (e.g., A, B & C, and D) are colored by pure green, blue, and red, respectively. White colored cells are empty cells (no images grouped in the cells). Examples of images grouped in the same SOM cells are given in the corresponding image rows to the right of the SOM. |


