
|
Fig. 7
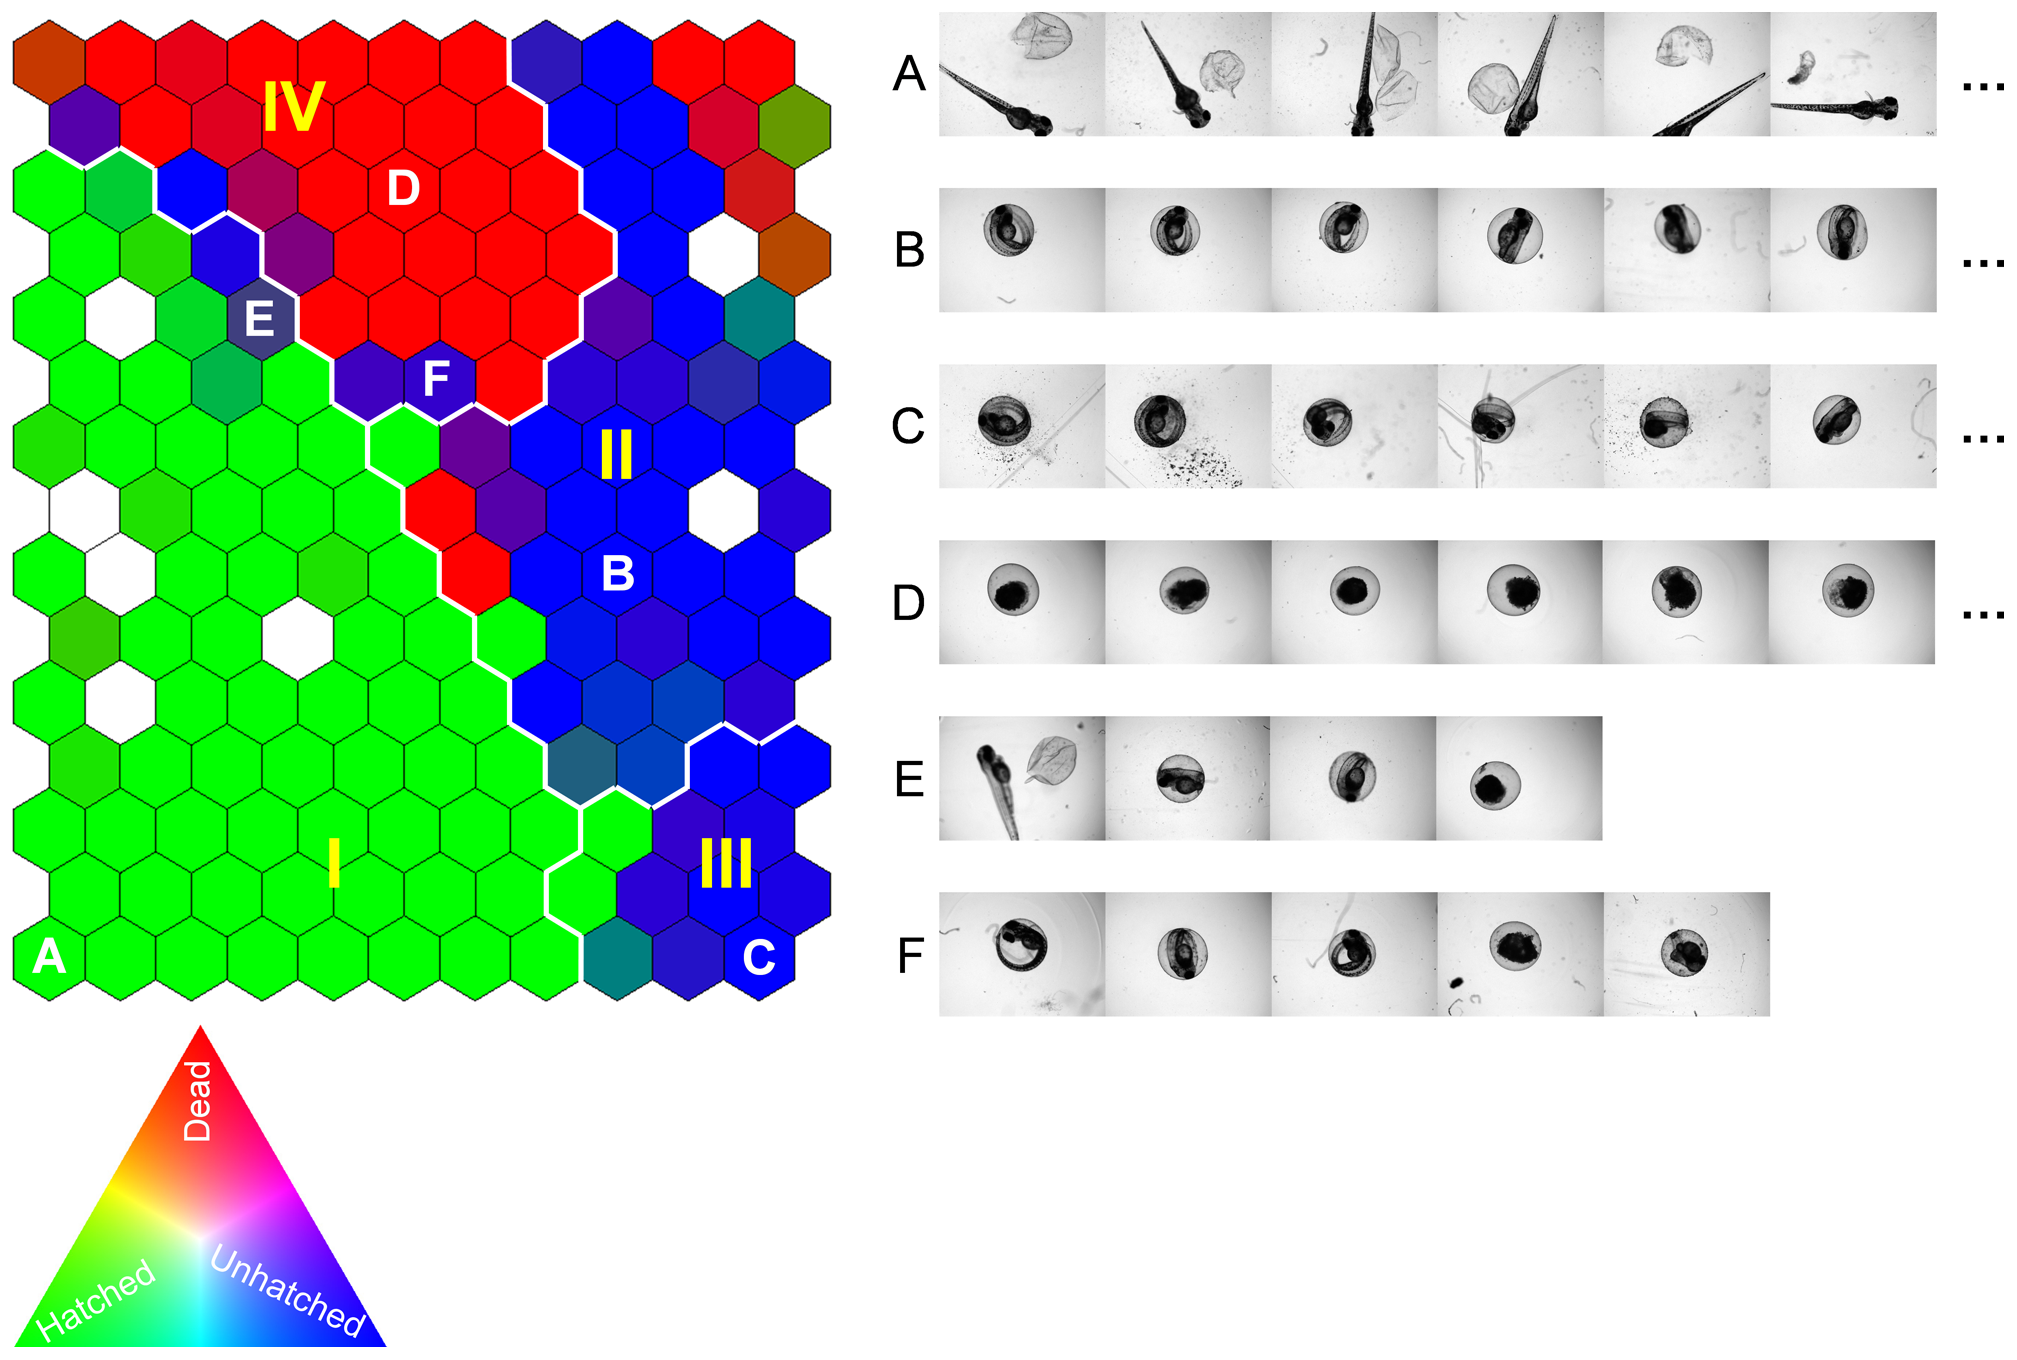
Self-Organizing Map (SOM) of the training image set described by the three selected image descriptors.
Similar images are organized as neighbors on the map and clusters I–IV are the four primary clusters identified by SOM analysis. The SOM cells are colored by [R, G, B] = [Ndead, Nhatched, Nunhatched]/N, where Ndead, Nhatched, and Nunhatched identify the number of dead, hatched, unhatched zebrafish embryos grouped into a given cell, respectively, and N = Ndead+Nhatched+Nunhatched. Accordingly, homogeneous SOM cells of hatched, unhatched, and dead zebrafish embryos (e.g., A, B & C, and D) are colored by pure green, blue, and red, respectively. White colored cells are empty cells (no images grouped in the cells). Examples of images grouped in the same SOM cells are given in the corresponding image rows to the right of the SOM.