
FIGURE
Fig. 1
- ID
- ZDB-FIG-120423-2
- Publication
- Liu et al., 2012 - Automated phenotype recognition for zebrafish embryo based in vivo high throughput toxicity screening of engineered nano-materials
- Other Figures
- All Figure Page
- Back to All Figure Page
Fig. 1
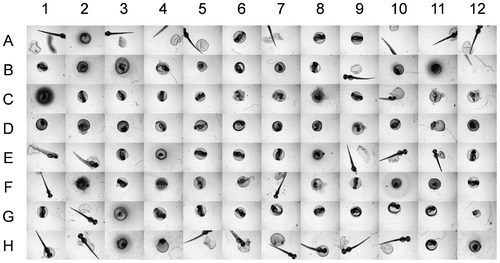
Images captured from a 96-well plate of zebrafish embryos. The embryos were treated with silver nanoparticles of concentration up to 15 mg·L-1. Examples of different phenotypes are: A1, E1, F1, H1′hatched embryos; B1, G1, C1′unhatched embryos; C1, D1, H12′dead embryos. C8, F2, and F7 illustrate images with significant deposits of eNMs. Images with chorion (eggshell) fragments are shown in A5, H7, and H8. Examples of zebrafish that are not completely captured by the imaging system (i.e., only a central portion of the well is imaged) are shown in A4, A7, and A10. |
Expression Data
Expression Detail
Antibody Labeling
Phenotype Data
Phenotype Detail
Acknowledgments
This image is the copyrighted work of the attributed author or publisher, and
ZFIN has permission only to display this image to its users.
Additional permissions should be obtained from the applicable author or publisher of the image.
Full text @ PLoS One