- Title
-
Cxcl12 evolution - subfunctionalization of a ligand through altered interaction with the chemokine receptor
- Authors
- Boldajipour, B., Doitsidou, M., Tarbashevich, K., Laguri, C., Yu, S.R., Ries, J., Dumstrei, K., Thelen, S., Dörries, J., Messerschmidt, E.M., Thelen, M., Schwille, P., Brand, M., Lortat-Jacob, H., and Raz, E.
- Source
- Full text @ Development
|
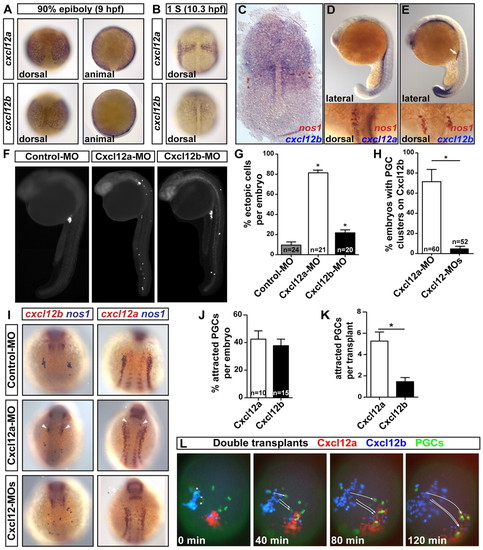
Cxcl12 subfunctionalization affects gene expression and chemotactic activity of Cxcl12. (A,B) Zebrafish cxcl12a and cxcl12b mRNA expression patterns as detected by in situ hybridization using probes of identical length and identical staining duration to allow direct expression level comparison at late gastrula stage (A) and at the onset of somitogenesis (B). (C) During early somitogenesis stages, the primordial germ cells (PGCs, brown) clearly reside outside of regions of high cxcl12b expression (blue). (D,E) At 22 hpf, the PGC positions correlate only with cxcl12a expression. Insets show magnified views of the developing gonads. Arrow, gonad region. (F) Knockdown of Cxcl12a, but not of Cxcl12b, expression results in strong PGC migration defects. (G) Quantitation of the results presented in F. (H) cxcl12b-expressing tissues attract PGCs in embryos knocked down for Cxcl12a. Shown is the percentage of embryos with more than three PGCs at cxcl12b-expressing tissues. (I) PGCs (nos1, blue) normally reach cxcl12a-expressing domains (top), but arrive at regions expressing cxcl12b when Cxcl12a is knocked down (middle), or are located randomly when both chemokines are knocked down (bottom). Arrowheads, PGCs located in cxcl12b expression domains. (J) Percentage of PGCs attracted by Cxcl12a-expressing or Cxcl12b-expressing transplanted cells. (K,L) The percentage of PGCs attracted by Cxcl12a-expressing (red in L) or Cxcl12b-expressing (blue in L) co-transplanted cells. Arrows indicate the movement of the marked cells (asterisks) (see Movie 1 in the supplementary material). Error bars depict s.e.m.; n, the number of embryos analyzed. *, P<0.05 compared with control (t-test). |
|
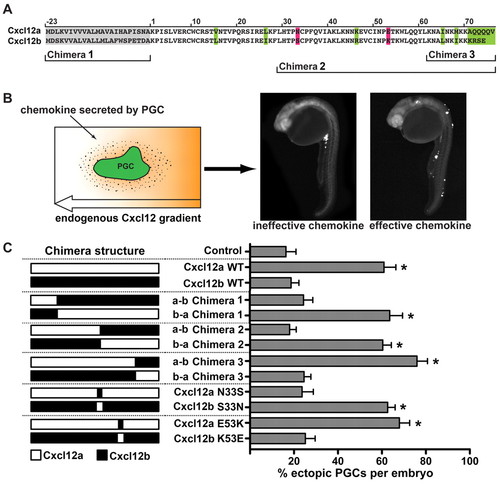
In vivo functional analysis of PGC migration in Cxcl12 mutants. (A) Sequence alignment of zebrafish Cxcl12a and Cxcl12b. The signal peptide is marked in gray and residues that differ between the ligands are colored. Domain swaps in chimeric proteins used in C are indicated and the position of the analyzed point mutations highlighted in magenta. (B) Expression of a specific Cxcl12 form directed to the PGCs results in a local field of this protein that can interfere with the endogenous Cxcl12a gradient. Expression of an ineffective version of the ligand does not interfere with the migration of PGCs (left), whereas an effective ligand interferes with the gradient of the guidance cue (right). (C) The activity of chimeric and mutated Cxcl12 molecules in this assay. Bars show the mean percentage of ectopic PGCs per embryo. Error bars depict s.e.m. *, P<0.05 compared with control (ANOVA). |
|
Cxcl12 subfunctionalization affects the function of the Cxcl12 paralogs in gastrulation. (A) Knockdown of Cxcl12b slows down the migration of endodermal cells. Note the gap between the forerunner (arrowheads) and the endodermal cells. (B) The gastrulation phenotype induced by knockdown of Cxcl12b is effectively reverted by wild-type Cxcl12b as well as by the N33S Cxcl12a protein. Error bars depict s.e.m. |
|
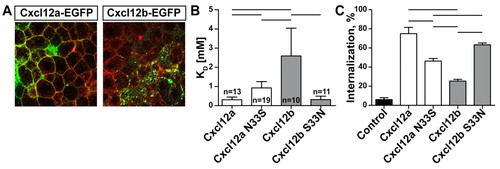
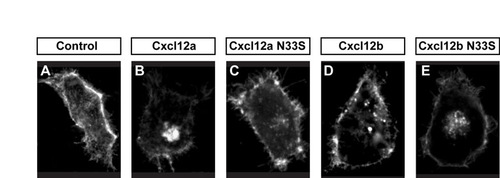
Subfunctionalization of Cxcl12 affects the affinity towards and activation of Cxcr4. (A) The concentration of free ligand is compared with the concentration of ligand (green) on Cxcr4b-containing membranes (red). (B) Median apparent KD values of dual-color FCS measurements. Error bars depict 95% confidence intervals and n is the number of measurements performed. Horizontal bars identify significant pairwise differences; P<0.05 (Kolmogorov-Smirnov test). (C) Internalization of Cxcr4b as a measure of Cxcl12 activity in vitro. Mean percentage of HEK293T cells expressing Cxcr4-YPet showing receptor internalization following incubation with recombinant Cxcl12 or with control ligand-free medium (see Fig. S2 in the supplementary material for representative results). Error bars represent s.e.m. Three experiments with 100 cells each were performed. Significant pairwise differences are identified by horizontal bars; P<0.05 (one-way ANOVA). |
|
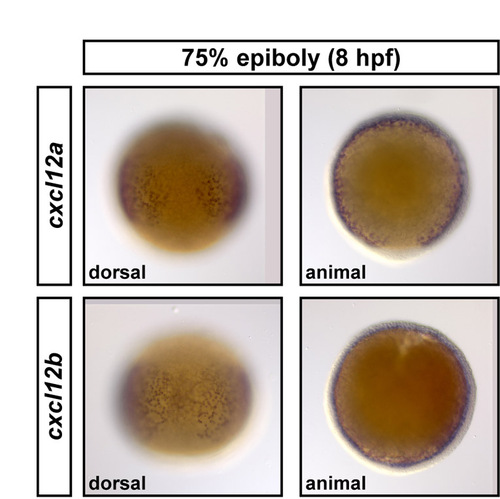
cxcl12a and cxcl12b mRNA expression patterns during mid-gastrulation. Dorsal and animal views of zebrafish embryos revealing the cxcl12a and cxcl12b mRNA expression patterns during mid-gastrulation using equal-length probes and identical staining conditions. |
|
The Cxcl12 30s loop is crucial for receptor affinity and activation. (A-E) Receptor internalization of Cxcr4b as a measure of Cxcl12 activity in vitro. Representative confocal images of HEK293T-Cxcr4b-YPet cells after incubation with conditioned medium containing the different Cxcl12 versions. |

