
Fig. 5
- ID
- ZDB-IMAGE-260406-58
- Genes
- Publication
- Lee et al., 2026 - SUPT16H-associated neurodevelopmental disorder and neurocristopathy: genetic and phenotypic spectrum
- All Figures
- Figures for Lee et al., 2026
|
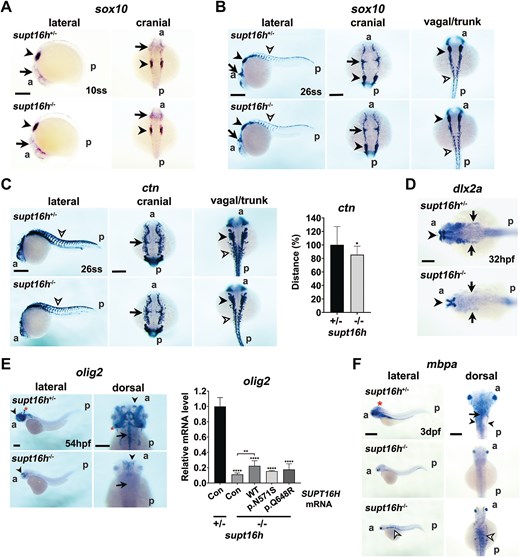
Fig. 5 Disruption of neural crest and glial development in supt16h−/− embryos. Whole-mount in situ hybridization (WISH) was performed using antisense RNA probes targeting neural crest– And glial-marker genes. (A) sox10-positive premigratory cranial neural crest cells at the 10-somite stage (ss) in supt16h+/− and supt16h−/− embryos. A, anterior; p, posterior; arrow, cranial neural crest cells; arrowhead, otic placode. Scale bar, 200 μm. (B) sox10-positive premigratory and early migrating vagal/trunk neural crest cells at 26 ss in supt16h+/− and supt16h−/− embryos. A, anterior; p, posterior; arrow, cranial neural crest cells; black arrowhead, otic placode; open arrowhead, trunk neural crest cells. Scale bars, 200 μm. (C) Ctn-positive migrating cranial (arrow), vagal (arrowhead), and trunk (open arrowhead) neural crest cells at 26 ss in supt16h+/− and supt16h−/− embryos. A, anterior; p, posterior. Scale bars, 200 μm. The graph quantifies the migration distance of vagal and trunk neural crest cells, measured from the midline to the leading edge of laterally migrating cells (n ≥ 12 embryos per group). Data are presented as mean ± SD. (D) dlx2a-positive cranial neural crest cells in the ectomesenchyme of the pharyngeal arches (arrow) at 32 hpf in supt16h+/− and supt16h−/− embryos (n ≥ 16 per group). A, anterior; p, posterior. (E) olig2-positive oligodendrocytes in supt16h+/− and supt16h−/− embryos at 54 hpf (n ≥ 15 embryos per group). Arrow, midline in the CNS; arrowhead, forebrain; asterisk, cerebellum. Scale bars: 400 μm (lateral view) and 200 μm (dorsal view). Expression of olig2 mRNA was quantified in 2 dpf supt16h+/− and supt16h−/− embryos injected with wild-type SUPT16H (WT), SUPT16H variants [c.1943A > G (p.N571S) or c.1712A > G (p.Q648R)], or TagRFP mRNA (con, control) by qRT-PCR (n ≥ 16 per group). Data are presented as mean ± SD. (F) Mbpa-positive myelinated oligodendrocytes and Schwann cells in supt16h+/− and supt16h−/− embryos at 3 dpf (n > 25 per group). A, anterior; p, posterior; arrow, oligodendrocytes at the midline of the CNS; arrowhead, Schwann cells in the PNS; open arrowhead, migrating neural crest cells undergoing premature differentiation. Scale bars: 400 μm (lateral view) and 200 μm (dorsal view). Statistical significance was determined using one-way ANOVA followed by Dunnett’s multiple comparison test, or Welch’s t-test; *P < 0.05, **P < 0.01, ****P < 0.0001. Abbreviations: ANOVA, analysis of variance; CNS, central nervous system; con, control (TagRFP mRNA-injected); ctn, crestin; dpf, days post-fertilization; dlx2a, distal-less homeobox 2a; hpf, hours post-fertilization; mbpa, myelin basic protein a; PNS, peripheral nervous system; qRT-PCR, quantitative reverse-transcription polymerase chain reaction; SD, standard deviation; ss, somite stage; SUPT16H, suppressor of ty 16 protein; supt16h, suppressor of ty 16 homolog (zebrafish gene); WT, wild type.