
IMAGE
Fig. 4
- ID
- ZDB-IMAGE-260203-10
- Genes
- Publication
- Herget et al., 2025 - Pth4 neurons define a novel hypothalamic circuit that promotes sleep via brainstem monoaminergic neurons
- All Figures
- Figures for Herget et al., 2025
Image
|
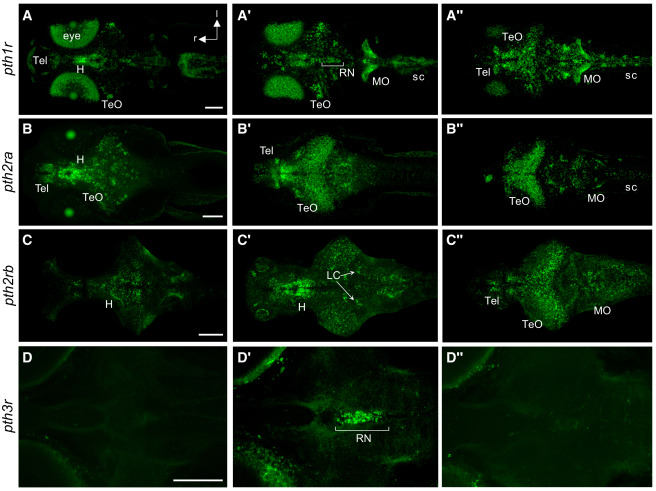
Figure Caption
Fig. 4 Expression of pth receptors in the larval zebrafish brain HCR staining of 6 dpf larval zebrafish shows the expression patterns of pth1r (A–A″), pth2ra (B–B″), pth2rb (C–C″), and pth3r (D–D″) in ventral (A–D), central (A′–D′), and dorsal (A″–D″) substacks. l, lateral; r, rostral; H, hypothalamus; LC, locus coeruleus; MO, medulla oblongata; RN, raphe nuclei; sc, spinal cord; Tel, telencephalon; TeO, optic tectum. Scale bars, 100 μm. See also Figures S4–S6.
Figure Data
Acknowledgments
This image is the copyrighted work of the attributed author or publisher, and
ZFIN has permission only to display this image to its users.
Additional permissions should be obtained from the applicable author or publisher of the image.
Full text @ Curr. Biol.