
IMAGE
Fig. 3
- ID
- ZDB-IMAGE-250825-33
- Genes
- Publication
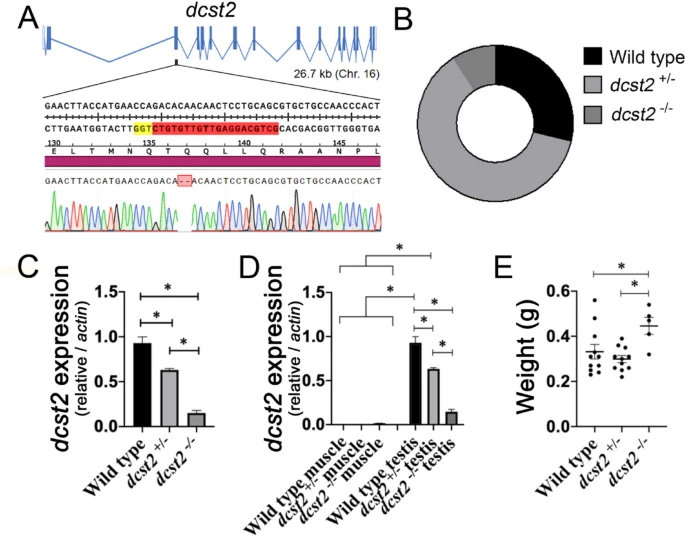
- Allard-Chamard et al., 2025 - Loss of dcst2 expression in male zebrafish is not associated with muscle hypertrophy
- All Figures
- Figures for Allard-Chamard et al., 2025
Image
|
Figure Caption
Fig. 3 Hematoxylin and eosin staining of male zebrafish trunk cryosections (A). Scale bar represents 500 μm. Insets of cross sections showing no obvious muscle fiber abnormalities (B), scale bar represents 50 µM. Tabulation of slow-twitch muscle fiber cross-sectional area between wild type and dcst2−/− muscle cells (C). Tabulation of fast-twitch muscle fibers cross-sectional area wild type and dcst2−/− zebrafish (D). No significant differences were found in any of our measures of muscle cells
Figure Data
Acknowledgments
This image is the copyrighted work of the attributed author or publisher, and
ZFIN has permission only to display this image to its users.
Additional permissions should be obtained from the applicable author or publisher of the image.
Full text @ Mol. Genet. Genomics