
Fig. 2
- ID
- ZDB-IMAGE-250820-13
- Genes
- Publication
- Ameen et al., 2025 - Genomic Analysis of Glaucoma Pathogenesis Due to gmds Mutation in Zebrafish
- All Figures
- Figures for Ameen et al., 2025
|
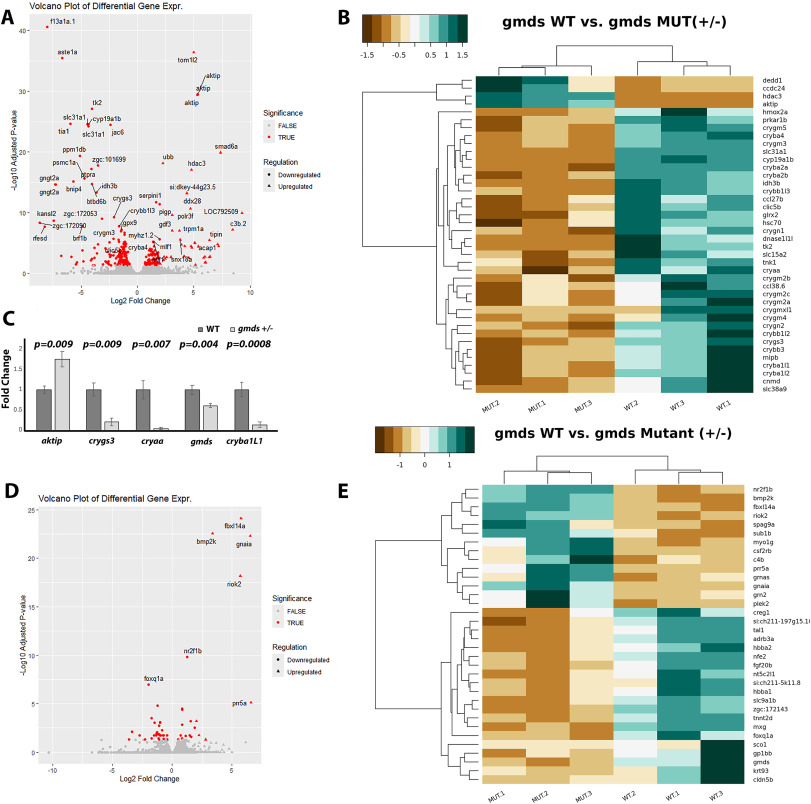
Fig. 2 Visualization of differentially expressed genes in gmds ± eyes. Volcano plot of differentially expressed genes from RNA sequencing of 12-month-old gmds ± zebrafish eyes (A) Genes with red color have -log10 Adjusted p-value ≤ 0.05 (Significant) while genes in grey color have -log10 Adjusted P-value >0.05) (not significant). Heatmap visualization of selected significantly dysregulated genes highlights the dysregulation of stress response and cell death genes (B). Selected genes that were verified via qPCR are shown in (C), graphed as mean fold change ± SEM, with expression in WT set to 1. Volcano plot at 24 months shows nr2f1b and other transcription regulation genes significantly upregulated (D). Heatmap showing visualization of all significantly dysregulated genes at 24 months in gmds mutants (E). (For interpretation of the references to color in this figure legend, the reader is referred to the Web version of this article.)
Reprinted from Experimental Eye Research, , Ameen, M.T., Alloway, H., Longjohn, M.N., Gendron, R.L., Paradis, H., Benoukraf, T., French, C.R., Genomic Analysis of Glaucoma Pathogenesis Due to gmds Mutation in Zebrafish, 110497, Copyright (2025) with permission from Elsevier. Full text @ Exp. Eye. Res.