IMAGE

Figure 6

ID
ZDB-IMAGE-250729-16
Genes
Source
Figures for Veshaal et al., 2025
Image
Figure Caption

Figure 6

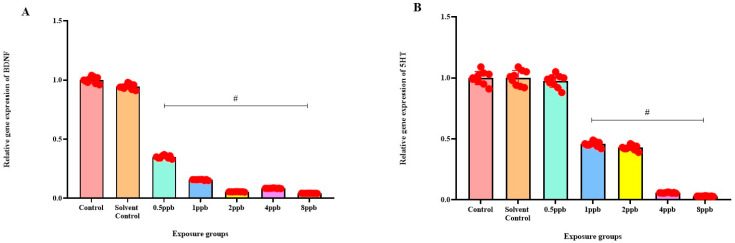
Expression of BDNF in zebrafish larvae exposed to different concentrations of BHA, control, and solvent control. # represents p < 0.05 statistically significant decrease compared with control (A) (n = 5). Expression of 5 HT in zebrafish larvae exposed to different concentrations of BHA, control, and solvent control. # represents p < 0.05 statistically significant decrease compared with control (B) (n = 5). Expression of COMT in zebrafish larvae that were exposed to different concentrations of BHA, control, and solvent control. # represents p < 0.05 statistically significant decrease compared with control (C) (n = 5). Expression of DRD4 in zebrafish larvae exposed to different concentrations of BHA, control, and solvent control. # represents p < 0.05 statistically significant decrease compared with control (D) (n = 5).

Figure Data
Acknowledgments
This image is the copyrighted work of the attributed author or publisher, and ZFIN has permission only to display this image to its users. Additional permissions should be obtained from the applicable author or publisher of the image. Full text @ J Xenobiot