
|
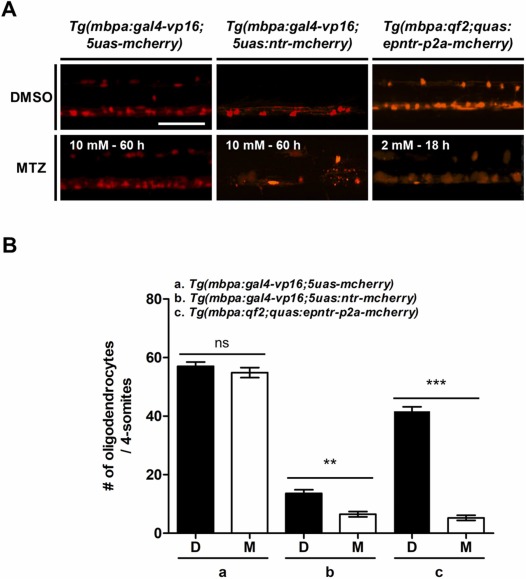
Fig. 1 The transgenic zebrafish model in the present study has superior oligodendrocyte ablation efficiency. (A) All images are lateral views of the spinal cord of transgenic zebrafish larvae, 6 and 8 days post-fertilization (dpf), anterior to the left and dorsal to the top. (B) In the spinal cord, fluorescence indicates mbpa:mCherry+ cells (oligodendrocytes, OLs). The graph represents the number of OLs in each 4-somite area. The experiment was repeated thrice (n = 10 per group). The data are presented as the mean ± SD. P-values were calculated using an unpaired Student’s t-test. Significance is indicated by **P < 0.01 and ***P < 0.001 vs. DMSO. ns: not significant. Scale bar: 200 μm.