IMAGE

Fig. 1.

ID
ZDB-IMAGE-250603-30
Source
Figures for Tapia et al., 2025
Image
Figure Caption

Fig. 1.

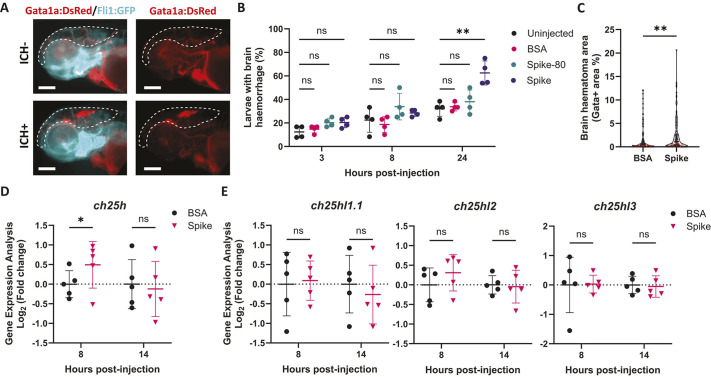
SARS-CoV-2 spike protein induces ch25h upregulation prior to spontaneous brain bleeding in zebrafish larvae. (A) Representative images of control [intracerebral haemorrhage (ICH)] and haemorrhagic (ICH+) Tg(fli1:EGFP)/Tg(gata1a:DsRed) 3 days post-fertilisation (dpf) larvae, 24 h after SARS-CoV-2 spike protein (spike) injection into the hindbrain (0.25 mg ml−1, 2 nl). Red indicates erythrocytes (gata1a+) and cyan indicates endothelial cells (fli1+). Dashed lines indicate the brain area. Scale bars: 250 µm. (B) Time course of ICH+ frequency in Tg(fli:EGFP)/Tg(gata1a:DsRed) larvae that were uninjected, injected with bovine serum albumin (BSA) control, injected with pre-heated spike at 80oC for 30 min (spike-80) or injected with spike conditions (n=4, 11-14 embryos per experiment). (C) Haematoma size (Gata+ area in brain region) in larvae 24 h post-injection with BSA or spike. Individual embryos are indicated as dots (n=146-147, three independent experiments). (D,E) Gene expression was analysed in larval heads 8 and 14 h after BSA or spike injections, for ch25h (D), ch25hl1.1, ch25hl2 and ch25hl3 (E) (30 larval heads pooled per replicate). Data are mean±s.d. (B,C,E) or median±interquartile range (IQR) (C). ns, non-significant; *P<0.05; **P<0.01; determined by repeated measures ANOVA with Dunnett's post-hoc test compared to uninjected (B), Mann–Whitney test (C) or randomised block two-way ANOVA with Sidak's post hoc analysis compared to BSA (D,E).

Acknowledgments
This image is the copyrighted work of the attributed author or publisher, and ZFIN has permission only to display this image to its users. Additional permissions should be obtained from the applicable author or publisher of the image. Full text @ Dis. Model. Mech.