IMAGE

Fig 4

ID
ZDB-IMAGE-250428-71
Genes
Publication
Kim et al., 2025 - Solute carrier family 2 member 2 (glucose transporter 2): a common factor of hepatocyte and hepatocellular carcinoma differentiation
All Figures
Figures for Kim et al., 2025
Image
Figure Caption

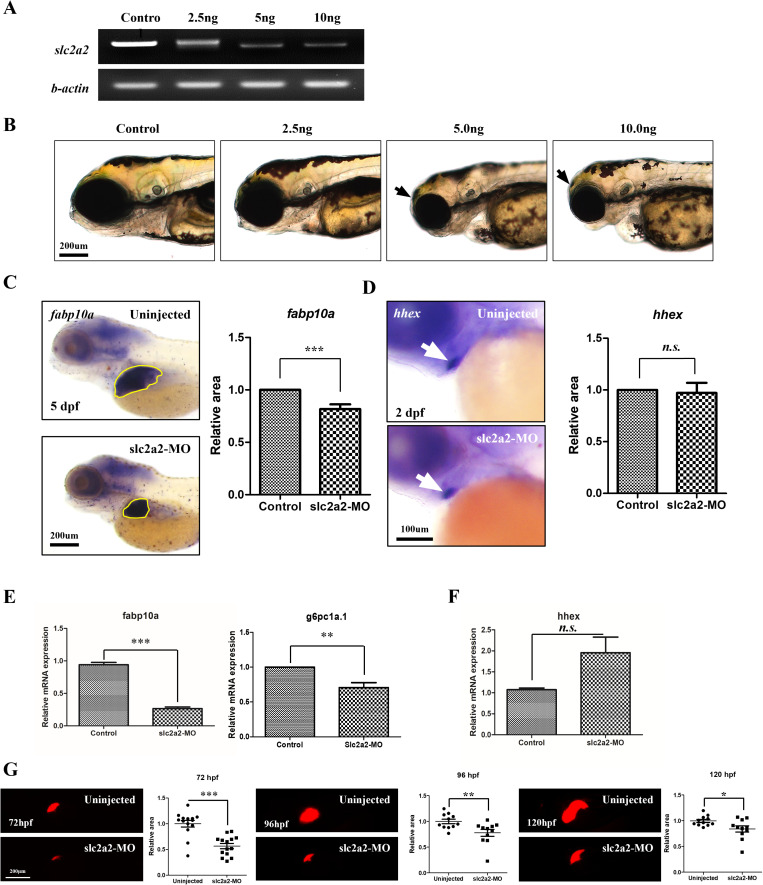
Fig 4 SLC2A2 is essential for liver differentiation in developing vertebrates

(A) RT‐PCR analysis of SLC2A2 and β‐actin using 4 dpf zebrafish embryos. Total RNA was isolated from uninjected control and SLC2A2 MO‐injected embryos (2.5, 5, and 10 ng). (B) Lateral view of zebrafish embryos after SLC2A2 MO-injection (2.5, 5, and 10 ng). The black arrow indicates heart edema in zebrafish embryos injected with 10 ng of SLC2A2-MO. (C) WISH images of uninjected embryos and SLC2A2-targeting morpholino-injected embryos at 5 dpf using fabp10a. The yellow line indicates fabp10a signal at the liver. (D) Using hepatoblast marker hhex, we captured WISH images of uninjected embryos and SLC2A2-targeting morpholino-injected embryos at 2 dpf. The white arrow indicates the hhex signal in the hepatoblast. (E) qRT-PCR analysis of fabp10a and hhex expression in uninjected embryos and SLC2A2-targeting morpholino-injected embryos at 4 dpf. mRNA expression is normalized to that of β-actin mRNA levels (*** indicates significance at p-value <0.001). Scale bars indicates 200 um. (F) Quantitative RT-PCR was used to measure hhex expression, normalized to β-actin mRNA levels. There was no significant difference (n.s.) observed in hhex expression between control and SLC2A2 MO-injected embryos. Data are represented as mean ± standard error of the mean (SEM). (G) Quantitative RT-PCR analysis was performed to evaluate the expression levels of igf1r. The mRNA expression levels were normalized to β-actin. A significant increase (p-value < 0.001, ***) in igf1r expression was observed in SLC2A2 MO-injected embryos compared to the control group. Data are presented as mean ± standard error of the mean (SEM). (G) Reduction in liver fluorescence intensity in zebrafish embryos following slc2a2 morpholino (MO) injection. Representative fluorescence microscopy images and quantitative analysis of liver fluorescence intensity in zebrafish embryos at 72, 96, and 120 hours post-fertilization (hpf). Uninjected embryos show consistent fluorescence in the liver across all time points, while embryos injected with slc2a2 MO exhibit a progressive reduction in fluorescence intensity. The fluorescence signal in slc2a2 MO-injected embryos decreased by approximately 60% at 96 hpf and 80% at 120 hpf compared to the uninjected controls.

Figure Data
Acknowledgments
This image is the copyrighted work of the attributed author or publisher, and ZFIN has permission only to display this image to its users. Additional permissions should be obtained from the applicable author or publisher of the image. Full text @ PLoS One