IMAGE

Figure 4

ID
ZDB-IMAGE-250423-70
Source
Figures for Reed et al., 2025
Image
Figure Caption

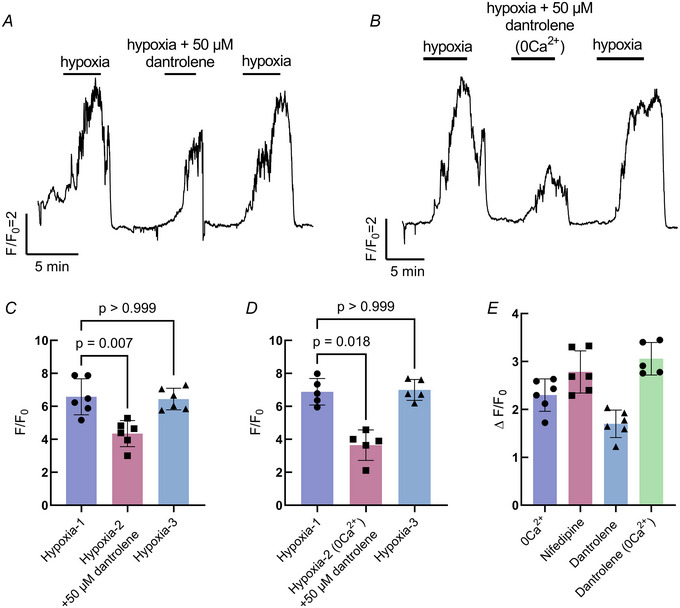
Figure 4 Intracellular Ca2+ contributes to the response to hypoxia in neuroepithelial cells (NECs)

A, Ca2+ imaging trace from a GCaMP‐containing NEC, where the response to hypoxia was reversibly reduced with the addition of 50 µm dantrolene, an inhibitor of intracellular Ca2+ release. B, Ca2+ imaging trace from a GCaMP‐containing NEC demonstrating the combined contributions of intracellular and extracellular Ca2+. The response to hypoxia was further reduced with the addition of 50 µm dantrolene in Ca2+‐free extracellular solution. C, summary data treated as in (A) showing reduction in the mean ± SD F/F0 (Kruskal–Wallis test, P = 0.007, n = 6 cells). The response to hypoxia fully recovered (Kruskal–Wallis test, P > 0.999, n = 6 cells). D, summary data treated as in (B) showing a reduction in the mean ± SD F/F0 (Kruskal–Wallis test, P < 0.008, n = 5 cells). The response to hypoxia fully recovered (Kruskal–Wallis test, P > 0.999, n = 5 cells). E, summary comparing all Ca2+ blocking treatments. The combination of dantrolene with Ca2+‐free extracellular solution resulted in an additive effect compared to dantrolene alone. [Colour figure can be viewed at wileyonlinelibrary.com]

Acknowledgments
This image is the copyrighted work of the attributed author or publisher, and ZFIN has permission only to display this image to its users. Additional permissions should be obtained from the applicable author or publisher of the image. Full text @ J. Physiol.