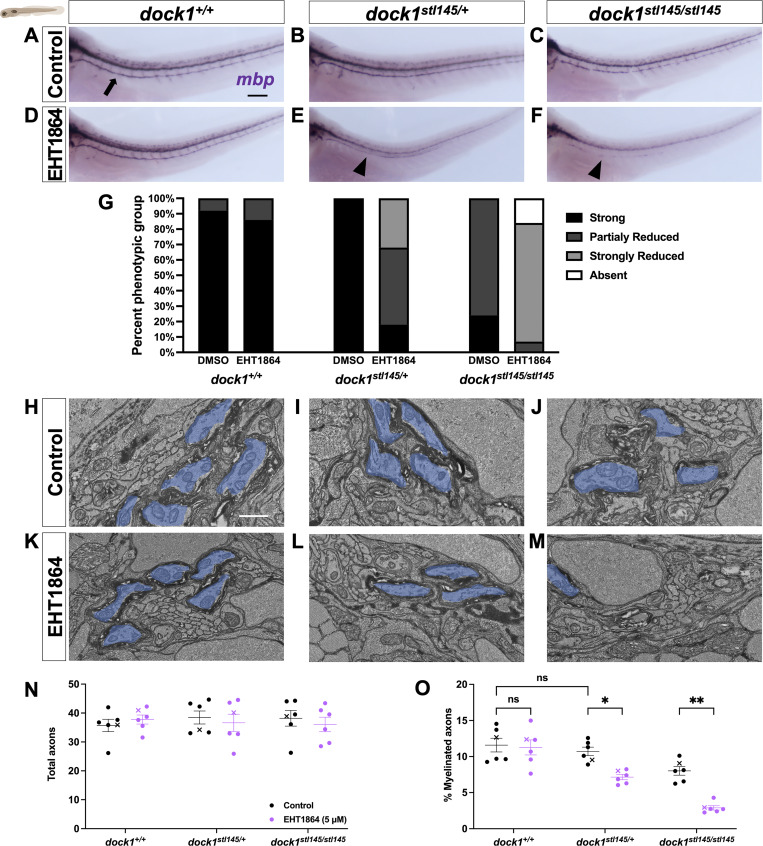
IMAGE

Figure 6.

ID
ZDB-IMAGE-250320-11
Genes
Source
Figures for Doan et al., 2025
Image
Figure Caption

Figure 6.

dock1 MUT zebrafish are sensitized to Rac1 inhibition. (A–F) Lateral views of larvae showing mbp expression by WISH in DMSO control-treated and EHT1864-treated WT dock1+/+, HET dock1stl145/+, and homozygous dock1stl145/stl145 MUT zebrafish. (A) The arrow points to strong mbp expression in the PLLn. (E and F) Arrowheads highlight decreased mbp expression in the PLLn. (G) The quantification of WISH was assessed by examining mbp expression along the entire PLLn in 4 dpf DMSO and EHT1864 zebrafish, comparing phenotypic scores and genotypes. (H–M) TEM micrographs of cross-sections of the PLLn, showing myelinated axons pseudocolored in blue, in DMSO control-treated and EHT1864-treated WT dock1+/+, HET dock1stl145/+, and homozygous dock1stl145/stl145 MUT zebrafish. (N and O) Quantifications of the total axons and myelinated axons in the PLLn. n = 6 fish per genotype (DMSO control) and 6 fish per genotype (EHT1864). Here, and in all figures, the X symbol in the graph denotes a data point corresponding to the representative image shown. (A–F) Scale bar = 100 µm. (H–M) Scale bar = 1 µm. (N and O) Two-way ANOVA with Sidak’s multiple comparisons test. **P < 0.01; *P < 0.05; ns, not significant.

Figure Data
Acknowledgments
This image is the copyrighted work of the attributed author or publisher, and ZFIN has permission only to display this image to its users. Additional permissions should be obtained from the applicable author or publisher of the image. Full text @ J. Cell Biol.