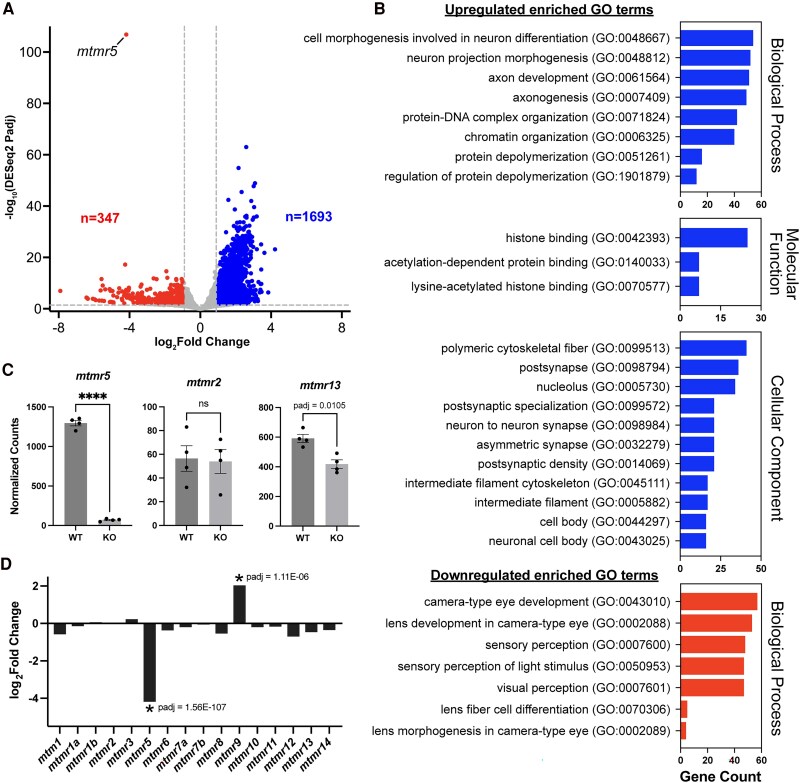
Bulk RNA sequencing of 7 dpf mtmr5-knockout versus wild-type brain-enriched samples. (A) Volcano plot displaying the differentially expressed genes in 7 days-post-fertilization (dpf) mtmr5-knockout (KO) zebrafish heads compared to wild-type (WT) siblings. A significance threshold of adjusted P-value (padj) < 0.01 and absolute log2 fold-change >1 was used. Upregulated genes are in the top right segment and downregulated genes are in top left segment. Number of significant genes in each category are indicated (upregulated, n = 1693; downregulated, n = 347). Each dot represents one zebrafish gene. See Supplementary Table 2 for the full list of genes, padj values, and log2fold-changes. (B) Gene ontology (GO) terms significantly enriched in the up- and down-regulated genes (padj < 0.01), sorted by the number of genes associated with the respective GO term (gene count). All enriched GO terms (padj < 0.05) are included in Supplementary Table 3. (C) Normalized read counts for the three CMT4B-associated MTMR genes: mtmr5, mtmr2 and mtmr13. ****padj < 0.00001, ns > 0.05. (D) Log2 fold-change values for all mtmr genes with significant values indicated (padj < 0.01). mtmr5 and mtmr13 gene names are used in place of sbf1 and sbf2, respectively.
This image is the copyrighted work of the attributed author or publisher, and
ZFIN has permission only to display this image to its users.
Additional permissions should be obtained from the applicable author or publisher of the image.
Full text @ Brain Commun
Your Input Welcome
Thank you for submitting comments. Your input has been emailed to ZFIN curators who may contact you if
additional information is required.
Oops. Something went wrong. Please try again later.