
Figure 2
- ID
- ZDB-IMAGE-250110-46
- Genes
- Publication
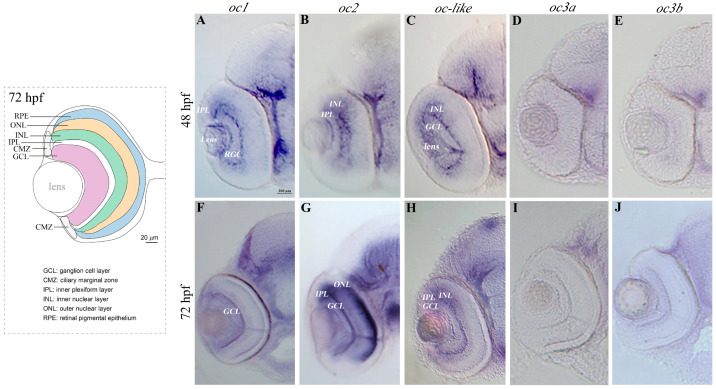
- Vassalli et al., 2024 - The Zebrafish Retina and the Evolution of the Onecut-Mediated Pathway in Cell Type Differentiation
- All Figures
- Figures for Vassalli et al., 2024
|
Figure 2
Territories of expression of