IMAGE

Figure 5.

ID
ZDB-IMAGE-241021-29
Source
Figures for El-Daher et al., 2024
Image
Figure Caption

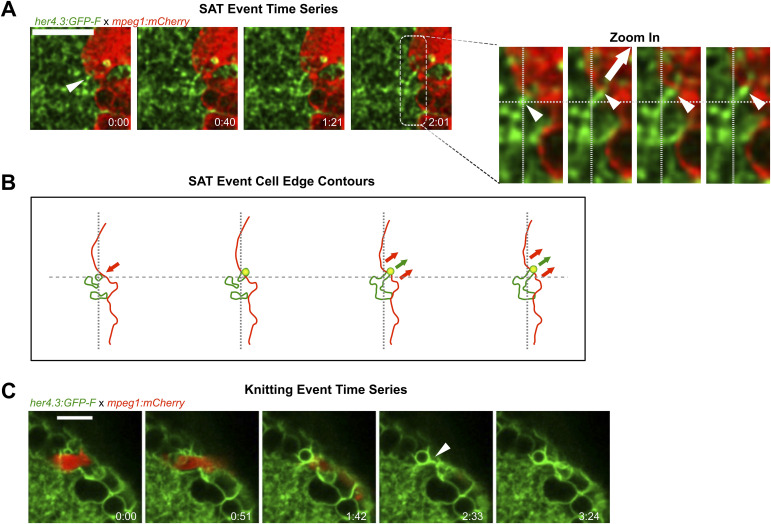
Figure 5. Microglial contacts displace astrocytic processes.

(A) Fast time-lapse imaging sequence on a Tg(her4.3:GFP-F);Tg(mpeg1:mCherry) larva showing an SAT process. The white arrow points out the adhesion event. (A′) Cropped sequence from (A). The small white arrows point to astrocytic protrusion pulled by microglia protrusion. The big arrow shows the direction of the traction force. The dashed line indicates the initial and final positions. (A, B) Outline of microglia (red) and astrocytic structures (green) from images in (A). Arrows show the direction of displacement. (C) Example of a knitting event. All scale bars: 10.

Acknowledgments
This image is the copyrighted work of the attributed author or publisher, and ZFIN has permission only to display this image to its users. Additional permissions should be obtained from the applicable author or publisher of the image. Full text @ Life Sci Alliance