
|
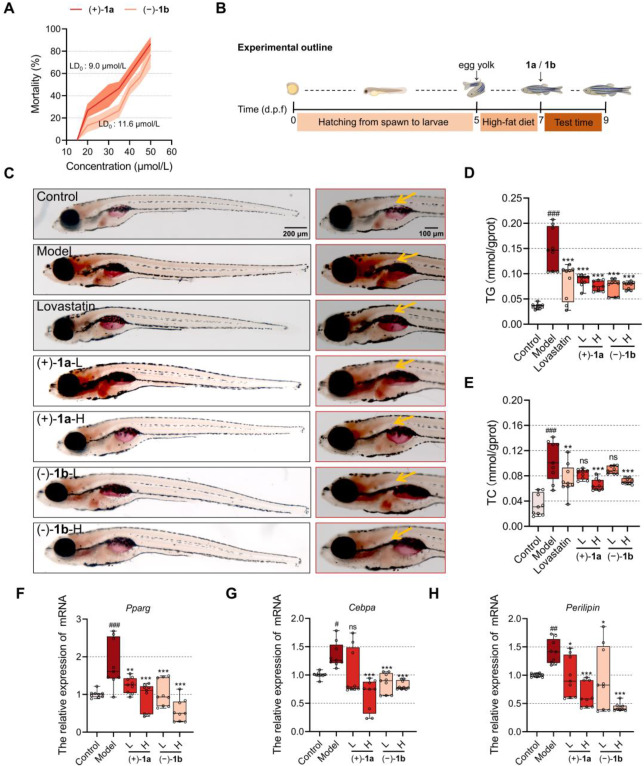
Fig. 5 (+)-1a and (−)-1b exert a lipid-lowering effect on HFD zebrafish. (A) Dose-toxicity curve of (+)-1a and (−)-1b on 5 dpf zebrafish. (B) Experimental outline of HFD zebrafish with (+)-1a and (−)-1b treatment. (C) Zebrafish stained with oil red o and visualized under a microscope, Lovastatin, positive control at 2.0 μg/mL, scale bar, 200, 100 μm. (D) TG measurement and (E)TC content were determined by manual methods, Lovastatin, positive control at 2.0 μg/mL. (F) The effects of (+)-1a and (−)-1b on relative mRNA expression level of Pparg. (G) The effects of (+)-1a and (−)-1b on relative mRNA expression level of Cebpa. (H) The effects of (+)-1a and (−)-1b on relative mRNA expression level of Perilipin. The data are expressed as mean ± SD (n = 10). ###P < 0.001 vs vehicle, nsP > 0.05, ∗P < 0.05, ∗∗P < 0.01, ∗∗∗P < 0.001 vs Model. L: low concentration; H: high concentration