IMAGE

Fig. 7

ID
ZDB-IMAGE-240531-142
Source
Figures for Lai et al., 2024
Image
Figure Caption

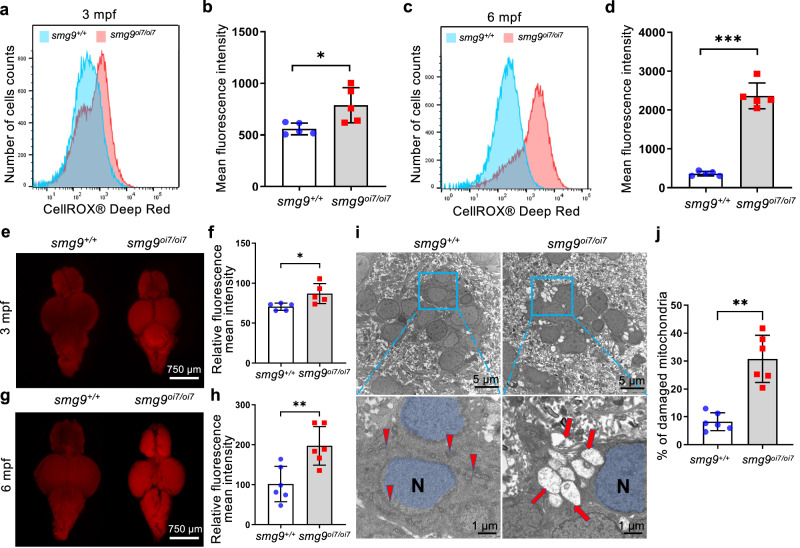
Fig. 7 ROS and acrolein accumulation in Smg9-deficient zebrafish.

a, c Representative flow cytometry histograms of CellROX fluorescence in smg9+/+ and smg9oi7/oi7 zebrafish at 3 mpf (a) and 6 mpf (c). b, d Mean fluorescence intensity of CellROX Deep Red in the brains of smg9+/+ and smg9oi7/oi7 zebrafish at 3 mpf (b) and 6 mpf (d). e, g Representative images of AcroleinRED staining of smg9+/+ and smg9oi7/oi7 zebrafish brains at 3 mpf (e) and 6 mpf (g). f, h Relative mean fluorescence intensities of smg9+/+ and smg9oi7/oi7 zebrafish brains at 3 mpf (f) and 6 mpf (h). i, j Representative images of transmission electron microscopy of smg9+/+ and smg9oi7/oi7 zebrafish brains at 6 mpf. The red arrowhead and red arrow indicate normal and damaged mitochondria, respectively. N Nucleus. Scale bar: 5 µm in the upper panel and 1 µm in the lower panel (i). The density of damaged mitochondria within a defined area (0.25 mm2) in the telencephalon region of six individual zebrafish brains (j). Error bars indicate SD. *P < 0.05, ** P < 0.01, and *** P < 0.001. ns: not significant.

Acknowledgments
This image is the copyrighted work of the attributed author or publisher, and ZFIN has permission only to display this image to its users. Additional permissions should be obtained from the applicable author or publisher of the image. Full text @ Commun Biol