IMAGE

Fig 7

ID
ZDB-IMAGE-240412-41
Source
Figures for Bhattarai et al., 2024
Image
Figure Caption

Fig 7

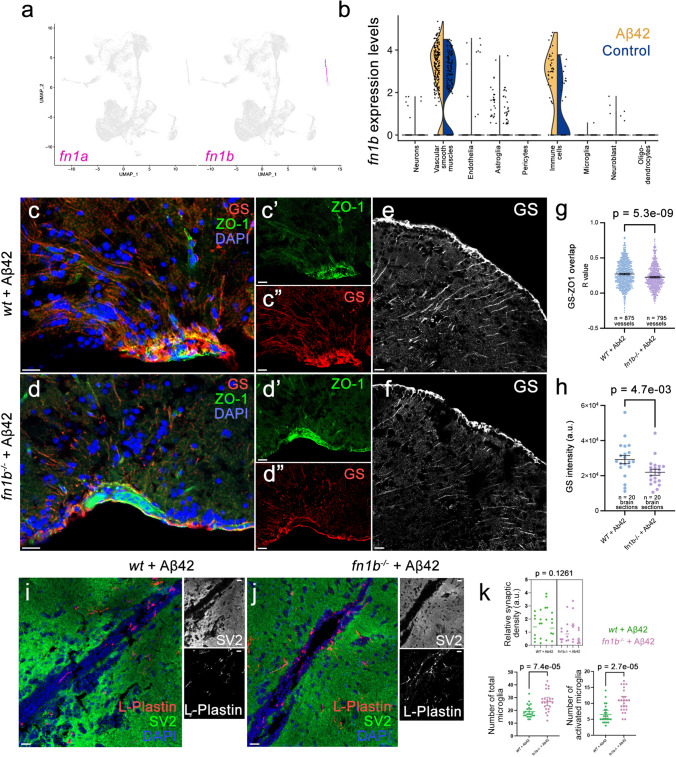
Fibronectin loss of function affects gliovascular interactions, gliosis, and microglial activity after amyloid toxicity in zebrafish brain. a Feature plots for fibronectin 1a (fn1a) and fibronectin 1b (fn1b) genes in zebrafish brain. b Violin plots in control and Aβ42-treated brains. fn1b is mainly expressed in vascular smooth muscle cells and immune cells and is upregulated with Aβ42. c, d Double IF for astroglia marker glutamine synthase (GS, red) and tight junction marker (ZO-1, green) in wild-type and fn1b−/− animals. Individual fluorescent channels in c′, c′′, d′, and d′′. e, f Individual GS channels. g Quantification for colocalization of ZO-1 and GS. h Comparison of intensity measurements for GS. i, j Double IF for synaptic marker SV2 (green) and microglial marker l-Plastin (red) in wild-type and fn1b−/− animals treated with Aβ42. Individual fluorescent channels in black–white channel. k Quantifications for synaptic density, total number of microglia, and activated microglia. Scale bars equal 25 µm

Figure Data
Acknowledgments
This image is the copyrighted work of the attributed author or publisher, and ZFIN has permission only to display this image to its users. Additional permissions should be obtained from the applicable author or publisher of the image. Full text @ Acta Neuropathol.