
FIGURE 4
- ID
- ZDB-IMAGE-240118-22
- Genes
- Antibodies
- Publication
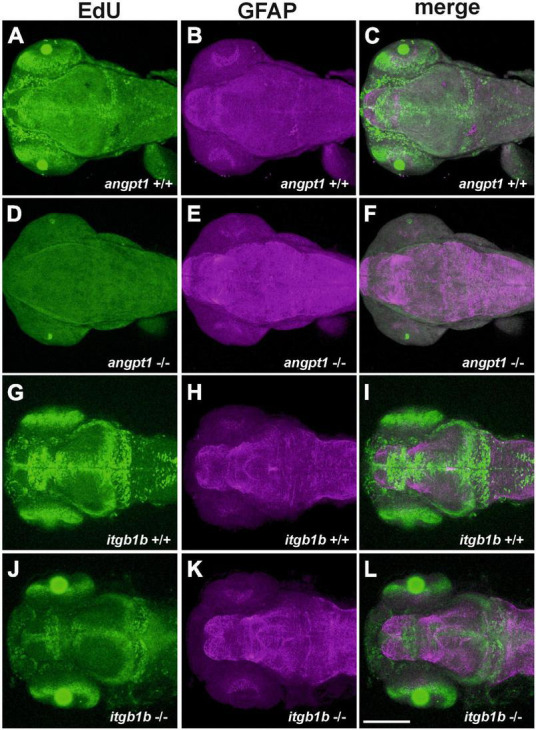
- Chen et al., 2024 - Angiopoietin 1 and integrin beta 1b are vital for zebrafish brain development
- All Figures
- Figures for Chen et al., 2024
|
FIGURE 4
Decreased proliferation and increased gfap intensity in