
Figure 2.
- ID
- ZDB-IMAGE-231024-3
- Publication
- Zhu et al., 2023 - SAMPL is a high-throughput solution to study unconstrained vertical behavior in small animals
- All Figures
- Figures for Zhu et al., 2023
|
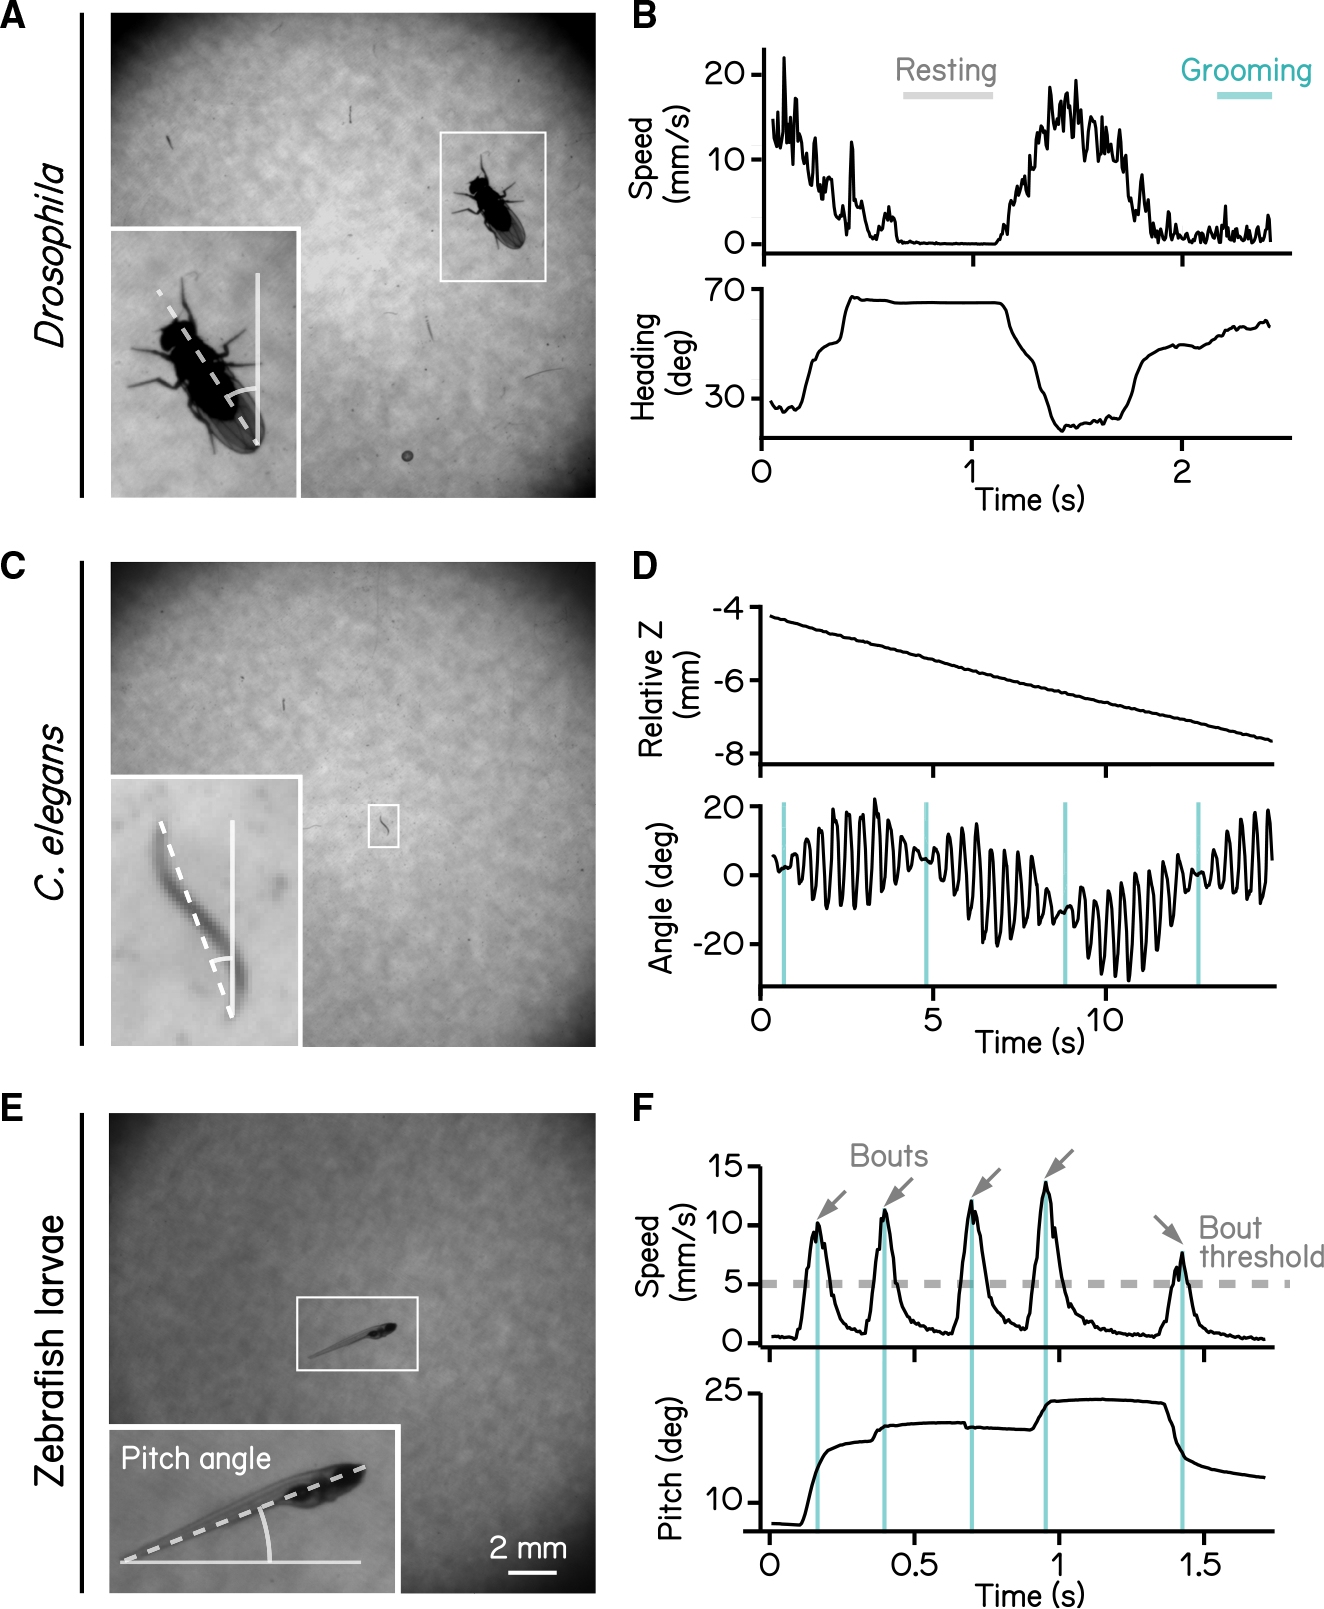
Figure 2. High-definition recording and measurement of animal locomotion using SAMPL
(A) Example of a recorded frame with a
(B) Example of an epoch of a walking fly. Walking speed and heading are plotted as a function of time. Gray and cyan lines mark resting and grooming periods, respectively (
(C) Example of a recorded frame with a
(D) Example of an epoch of a swimming worm. z position and approximated angle are plotted as a function of time. Cyan vertical lines label the time when the plane of movement is perpendicular to the imaging plane (
(E) Example of a recorded frame with a 7 dpf
(F) Example of an epoch containing multiple swim bouts (arrows). Swim speed and pitch angles are plotted as a function of time. Dashed line marks the 5 mm/s threshold for bout detection. Cyan vertical lines label time of the peak speed for each bout.
See also