
Fig. 1
|
Fig. 1
Deficits in baz1b lead to mild neurocristopathy in zebrafish
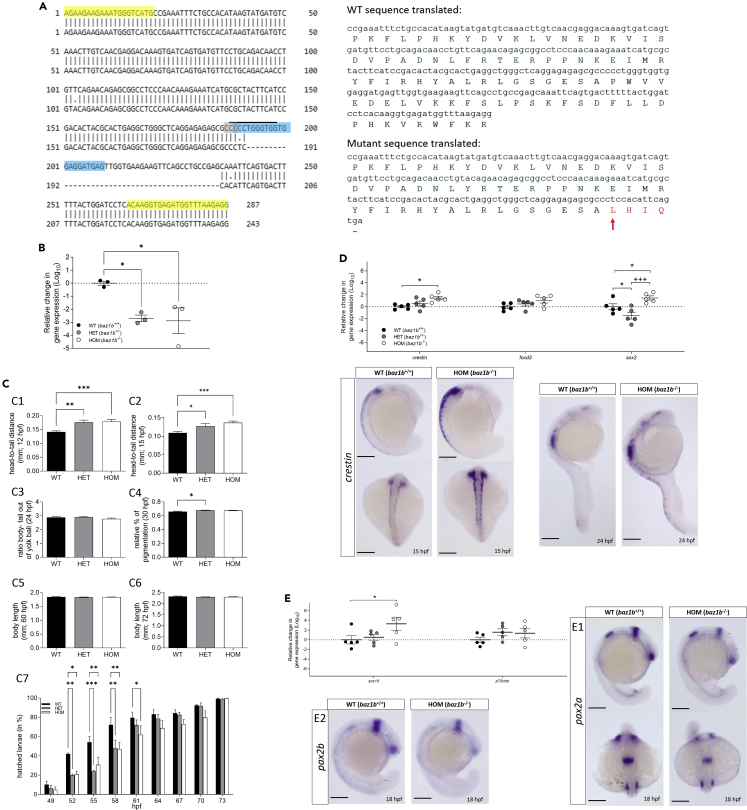
(A) Left panel shows a DNA blast for the portion of baz1b′s exon 5 amplified by PCR used for genotyping between WT (above) and mutants (below, 44 bp deletion). Primers used are highlighted in yellow, crRNA site in blue, PAM site in gray and restriction enzyme over-lined. Right panel shows the in-frame translation to amino acids (aa) sequences in WT (above) and mutants (below) of the same exon 5 portion. Arrow indicates mutation starting site, changed aa are in red and stop codon marked as a dash (−).
(B) Relative change in gene expression (log10) assessed by qPCR between 5 dpf larvae from each genotype showing that in both HET and HOM the expression of baz1b is significantly diminished with respect to WT. Figure shows individual values (N = 3 per genotype, each representing a group of 16 larvae combined) and mean ± SE mean (SEM).
(C) Developmental comparison between the three phenotypes for the head-to-tail distance at 12 (C1) and at 15 hpf (C2), ratio body/tail-out-of-yolk-ball at 24 hpf (C3), relative percentage of pigmentation at 30 hpf (C4), body length at 60 (C5) and at 72 hpf (C6), and percentage of hatched larvae between 49 and 73 hpf (C7).
(D) Relative change in gene expression (log10) for crestin, foxd3, and sox2 from each genotype at 24 hpf. Below panel shows whole larvae in situ hybridization (WISH) against crestin for WT and HOM at 18 and 24 hpf.
(E) Relative change in gene expression (log10) for sox10 and p75ntrb from each genotype at 24 hpf with WISH against pax2a (E1) and pax2b (E2), genes regulated by baz1b. Graphs show mean ± SEM. In all cases: ∗p < 0.05; ∗∗p < 0.01; ∗∗∗p < 0.001; +++ p < 0.001. Statistical test: one-way ANOVA with Tukey correction for multiple comparison for B, C2, C4, C5, D, and E; non-parametric test of Kruskal-Wallis corrected for multiple comparison for C1, C3, and C6; two-way ANOVA with repeated measures with Tukey correction for multiple comparison for C7. Scale bars represent 200 μm.