
|
Fig 6
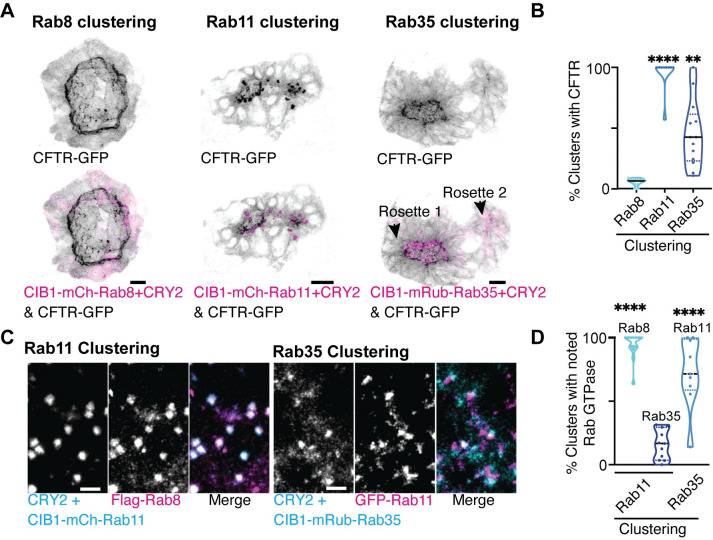
(A) Optogenetic clustering of Rab11, Rab8, and Rab35 (magenta) in KV cells. Localization with CFTR-GFP (inverted gray) is shown. Scale bar, 20 μm. (B) Violin plots depicting percent of optogenetic clusters that colocalize with CFTR. n>9 embryos, **p<0.01, ****p<0.0001. (C) Optogenetic clustering of CIB1-mCherry-Rab11 and CIB1-mRuby-Rab35 (cyan). CIB1-mCherry-Rab11 clusters localization with Flag-Rab8 (magenta) or CIB1-mRuby-Rab35 clusters with GFP-Rab11 (magenta) shown. Scale bar, 7 μm. (D) Violin plot depicting percent of optogenetic clusters that colocalize with Rab8, Rab35, or Rab11. n>9 embryos, ****p<0.0001. Statistical results detailed in S1 Table.