
Fig. 3
- ID
- ZDB-IMAGE-230512-7
- Genes
- Publication
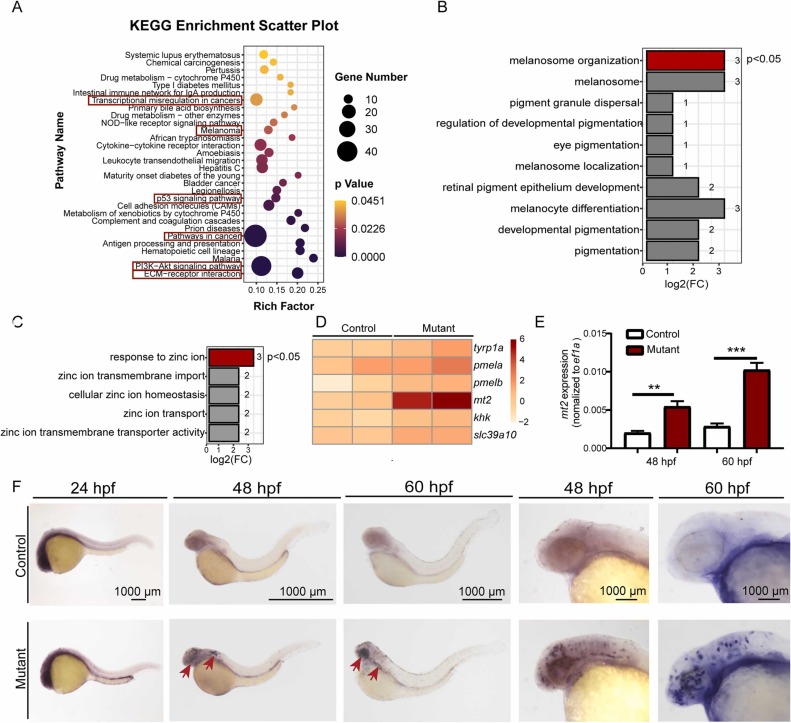
- Xia et al., 2022 - Zinc transporter Slc30a1 regulates melanocyte development by interacting with mt2 in zebrafish
- All Figures
- Figures for Xia et al., 2022
|
Fig. 3 Elevated mt2 expression in melanocytes of slc30a1 mutants. A, The 30 significantly changed KEGG pathways revealed by SMART-seq data. Pathways related to cancer development are highlighted by red rectangles. B-C, The GO terms related to pigment or melanocyte development (B) or zinc biology (C) revealed by SMART-seq data. D, Heatmap analysis of genes containing the significantly changed GO terms “melanosome organization” and “response to zinc ion”. E, The expression level of mt2 in control and mutant embryos detected by qPCR. F, Whole-mount in situ hybridization of mt2 in control and mutant embryos at different stages. The ysl and pigments in the head are indicated by red arrows. **p < 0.01 and ***p < 0.001. (For interpretation of the references to colour in this figure legend, the reader is referred to the web version of this article.)