
Fig. 5
- ID
- ZDB-IMAGE-230508-72
- Genes
- Publication
- Yu et al., 2022 - Changes in aggression and locomotor behaviors in response to zinc is accompanied by brain cell heterogeneity and metabolic and circadian dysregulation of the brain-liver axis
- All Figures
- Figures for Yu et al., 2022
|
Fig. 5
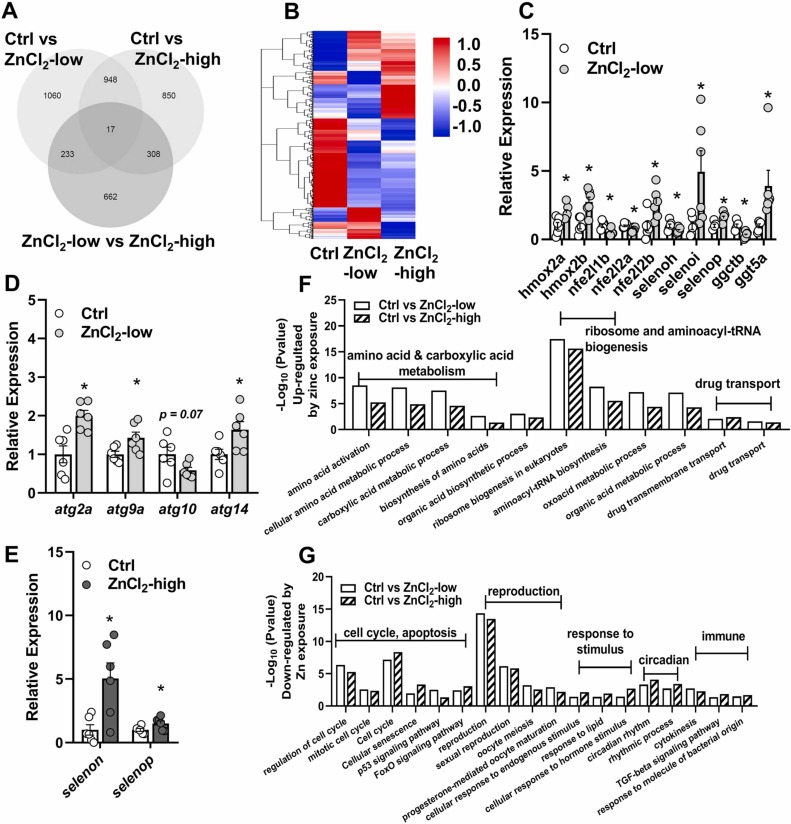
Fig. 5. General hepatic transcriptome signature after zinc exposure. Venn diagrams and heatmap of DEGs (A and B); signature DEGs associated with antioxidant physiology and autophagy in ZnCl2-low group (C and D) and antioxidant physiology in ZnCl2-high group (E); significantly enriched and up-regulated functions in ZnCl2-low and ZnCl2-high groups (F); significantly enriched and down-regulated functions in ZnCl2-low and ZnCl2-high groups (G) The screening criteria of enrichment analyses were p < 0.01 with enrichment genes ≥ 5 or 0.05 < p ≤ 0.01 with enrichment genes ≥ 10. Details of enrichment analyses are shown in Table S4.