
IMAGE
Figure 3
- ID
- ZDB-IMAGE-230420-73
- Genes
- Publication
- Guan et al., 2023 - Ghrelin regulates hyperactivity-like behaviors via growth hormone signaling pathway in zebrafish (Danio rerio)
- All Figures
- Figures for Guan et al., 2023
Image
|
Figure Caption
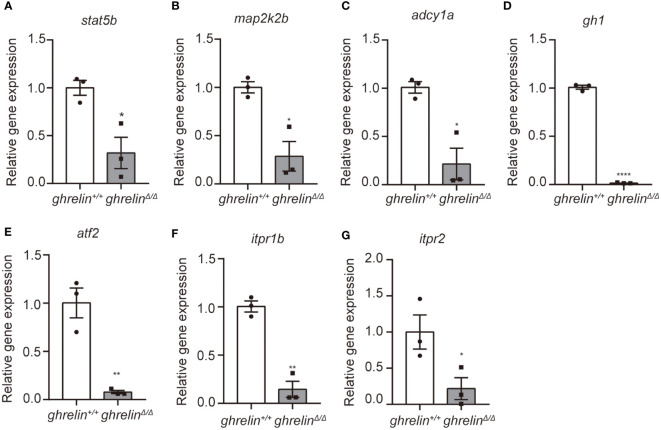
Figure 3
Quantitative real-time PCR analysis of candidate genes in the brain of adult ghrelinΔ/Δ zebrafish. (A–G) In order, the investigated genes are stat5b, map2k2b, adcy1a, gh1, atf2, itpr1b, itpr2. N= 3, *P < 0.05, **P < 0.01, ****P < 0.0001, unpaired Student's t-test.
Figure Data
Acknowledgments
This image is the copyrighted work of the attributed author or publisher, and
ZFIN has permission only to display this image to its users.
Additional permissions should be obtained from the applicable author or publisher of the image.
Full text @ Front Endocrinol (Lausanne)