
Figure 5
- ID
- ZDB-IMAGE-221226-260
- Genes
- Publication
- Weaver et al., 2022 - gldc Is Essential for Renal Progenitor Patterning during Kidney Development
- All Figures
- Figures for Weaver et al., 2022
|
Figure 5
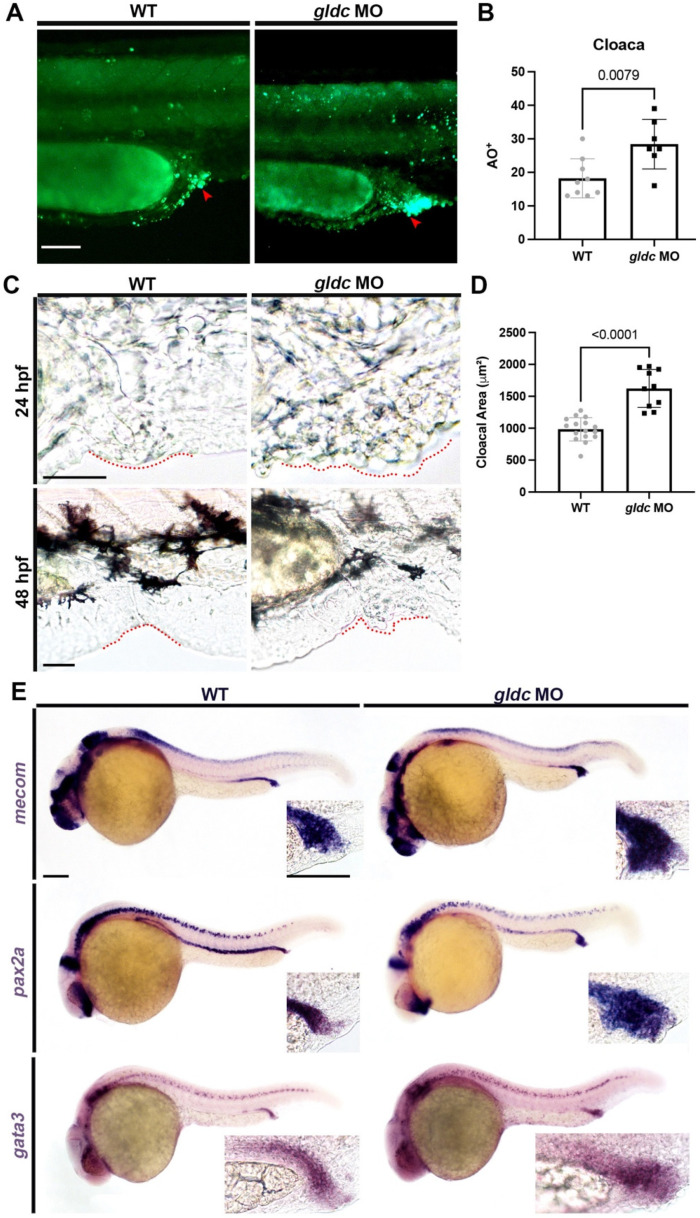
gldc morphant cloacae demonstrate increased levels of apoptosis and structural abnormalities. (A) Cell death assay of the cloaca in WT and gldc morphants at 24 hpf. Scale bar = 50 μM. (B) Quantification of AO+ cells in the cloaca; red arrowheads indicate example AO+ cells. (C) Live images of the cloacal region (outlined in red) in WT and gldc morphants at 24 hpf and 48 hpf. Scale bars = 50 μM. (D) Measurement of the cloacal area in WT and gldc MO. (E) WISH of mecom, pax2a, and gata3 in WT and gldc morphants at 24 hpf revealed enlarged cloacal regions. Scale bars = 100 μM. Data are mean ± s.d. AO+ cell counts and cloacal area were compared with unpaired T-tests.