
|
Fig. 8
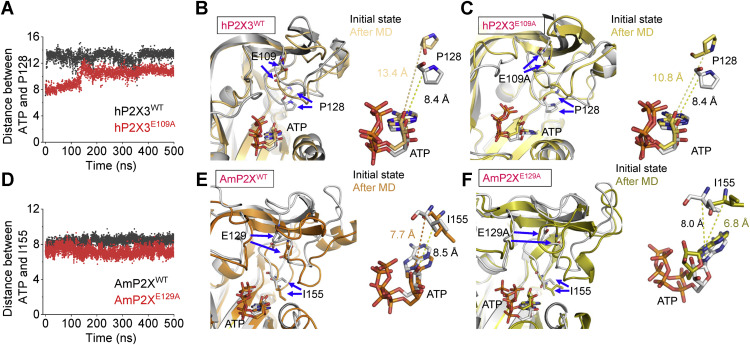
Figure 8. Molecular dynamics (MD) simulations of hP2X3WT, AmP2XWT, and their equivalent mutants. A, distance measurements between ATP and P128 during 0.5-μs MD simulations of hP2X3WT and hP2X3E109A. B and C, superimpositions of initial open structure and conformations after MD simulations of hP2X3WT and hP2X3E109A. The dashed lines indicate the distance between the Cα of P128 and N9 atoms of ATP. D, distance measurements between ATP and I115 during 0.5-μs MD simulations of AmP2XWT and AmP2XE129A. E and F, superimpositions of initial open structure and snapshots after MD simulations of AmP2XWT and AmP2XE129A. The trajectories were sampled every 200 ps. AmP2X, gulf coast tick (Amblyomma maculatum) P2X; hP2X3, human (Homo sapiens) P2X3.