
IMAGE
FIGURE 4
- ID
- ZDB-IMAGE-220921-54
- Genes
- Publication
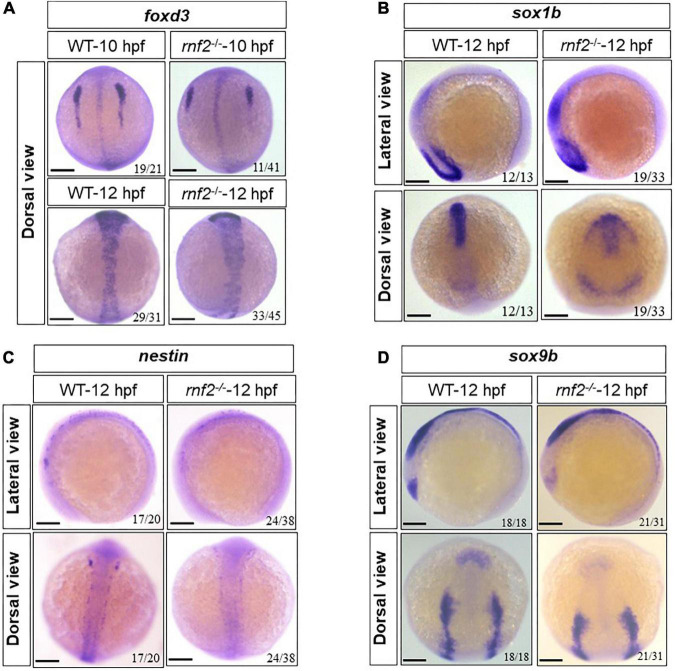
- Feng et al., 2022 - The Polycomb group gene rnf2 is essential for central and enteric neural system development in zebrafish
- All Figures
- Figures for Feng et al., 2022
Image
|
Figure Caption
FIGURE 4
The effect of loss of
Figure Data
Acknowledgments
This image is the copyrighted work of the attributed author or publisher, and
ZFIN has permission only to display this image to its users.
Additional permissions should be obtained from the applicable author or publisher of the image.
Full text @ Front. Neurosci.