
Fig. 9
- ID
- ZDB-IMAGE-220920-74
- Genes
- Publication
- Tian et al., 2022 - WRN promotes bone development and growth by unwinding SHOX-G-quadruplexes via its helicase activity in Werner Syndrome
- All Figures
- Figures for Tian et al., 2022
|
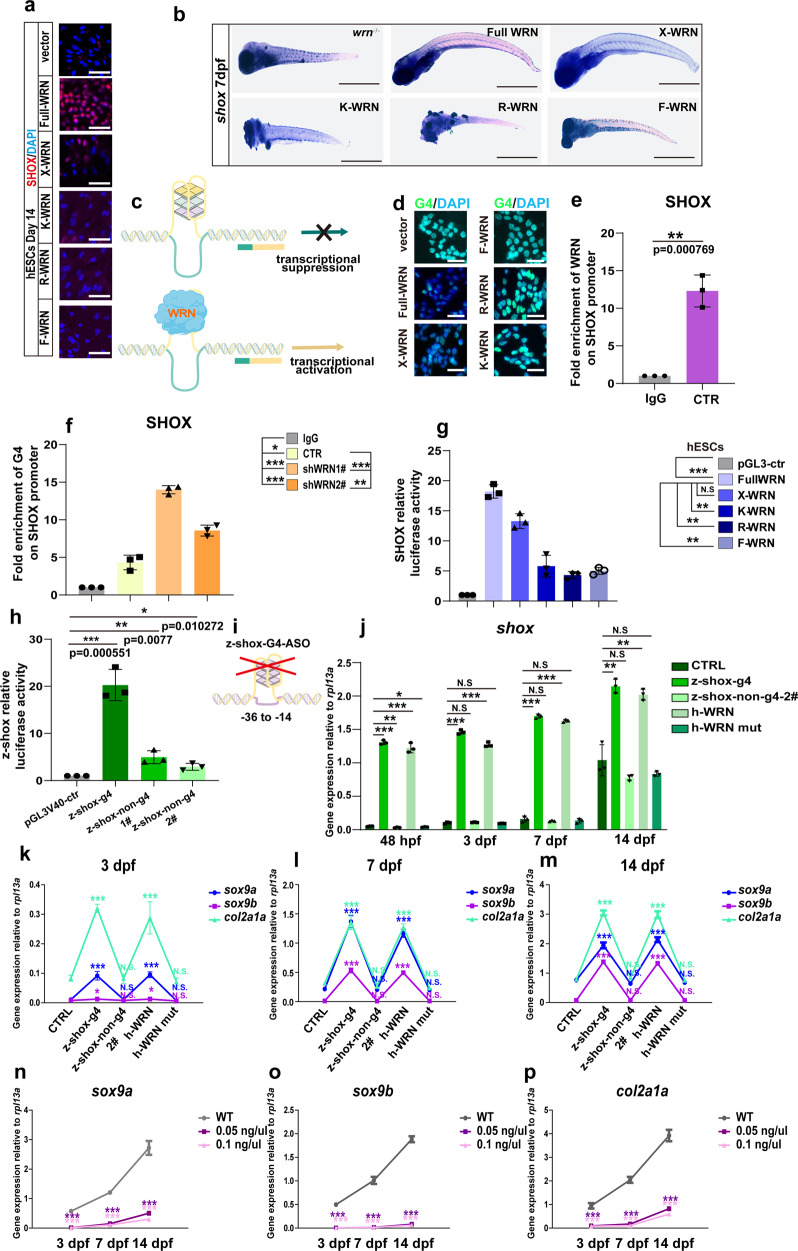
Fig. 9
a Representative immunofluorescent staining of 3 independent experiments with different WRN mutant plasmids in hESCs on day 14. SHOX was examined. Scale bar = 50 µm. b Representative WISH analysis of 3 independent experiments of the expression of shox on 14 dpf. Scale bar = 50 µm. c Illustration of the mechanism of WRN in opening G-quadruplex. d Representative immunofluorescent images of 3 independent experiments with different WRN mutant plasmids in hESCs on day 14. G4 was examined. Scale bar = 50 µm. e Fold enrichment of WRN on SHOX promoter using ChIP-qPCR analysis. N = 3 independent biological experiments. f Fold enrichment of G4 on SHOX promoter using ChIP-qPCR analysis. N = 3 independent biological experiments. g Luciferase assay of the human SHOX transcription activity. h Luciferase assay of the zebrafish shox transcription activity. i Illustration of zebrafish shox-G4 anti-sense oligonucleotides design. j qRT-PCR measurement of shox. N = 3 independent biological experiments. k–m qRT-PCR measurement of sox9a, sox9b, and col2a1a at 3 dpf (k), 7 dpf (l), and 14 dpf (m). N = 3 independent biological experiments. n–p qRT-PCR measurement of sox9a (n), sox9b (o), and col2a1a (p) at different time points. N = 3 independent biological experiments. Data are presented as the mean ± S.D. Statistical analysis was performed using two-tailed unpaired Student’s t-test. *P < 0.05, **P < 0.01, ***P < 0.001.