
Fig. 5
- ID
- ZDB-IMAGE-220920-70
- Genes
- Publication
- Tian et al., 2022 - WRN promotes bone development and growth by unwinding SHOX-G-quadruplexes via its helicase activity in Werner Syndrome
- All Figures
- Figures for Tian et al., 2022
|
Fig. 5
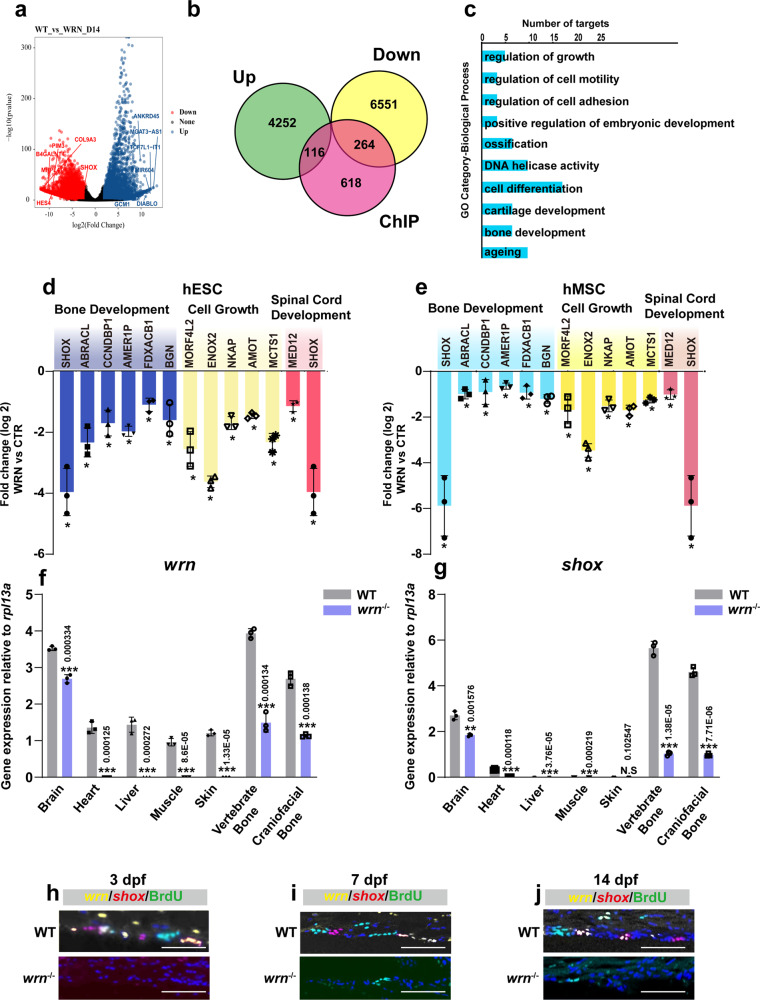
a Volcano plot was depicted with the fold change on day 14. P values were calculated by empirical Bayes moderated t test in limma combined with Benjamini–Hochberg method adjustment. Genes with an adjusted p-value of ≤ 0.05 and |log2 fold change | > 0.5 were considered as significantly changed. Top upregulated genes (blue) and downregulated changed genes (red) were shown. b The overlay of RNA-seq and ChIP-seq analysis showed the genes were potential direct targets of WRN in chondrogenic homeostasis. c GO functional clustering of genes that were for identification of biological processes directly regulated by WRN. Representative downregulated categories were shown. d, e qRT-PCR validation analysis showed the mRNA expression fold change among bone development, cell growth, and spinal cord development-associated genes in the CTR vs WRN-KD chondrocytes in the hESCs (g) and hMSCs (h) on day 14. N = 3 independent biological experiments. The error bar represents the standard deviation (s.d.) and P-value was generated by using one-way ANOVA with the Tukey’s post hoc test. f, g qRT-PCR measurement of the expression of wrn and shox in different tissue in WT and wrn−/− mutant zebrafish at 40 dpf. N = 3 independent biological experiments. Data are presented as the mean ± S.D. Statistical analysis was performed using two-tailed unpaired Student’s t-test. h–j Representative FISH analysis of three independent experiments of wrn and shox in WT zebrafish and wrn−/− mutant zebrafish at 3 dpf, 7 dpf, and 14 dpf. Scale bar = 100 µm. *P < 0.05, **P < 0.01, ***P < 0.001.